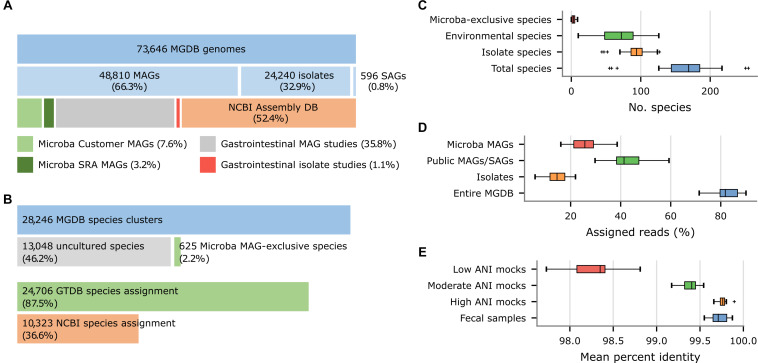
FIGURE 5.
Properties of the Microba Genome Database (MGDB) and the results of profiling 33 US fecal samples using the MCP with the MGDB as a reference database. (A) Proportion of MAGs, isolates, and SAGs within the 73,646 genomes comprising the MGDB along with the source of these genome assemblies. Gastrointestinal MAGs were recovered from the studies of Almeida et al. (2019), Nayfach et al. (2019), and Pasolli et al. (2019) and gastrointestinal isolates from the studies of Forster et al. (2019) and Zou et al. (2019). (B) Proportion of the 28,246 MGDB species clusters comprised exclusively of uncultured genomes (i.e., MAGs or single-amplified genomes) obtained from multiple sources or solely of MAGs recovered by Microba. This is followed by the proportion of MGDB species clusters that can be assigned a GTDB or NCBI species assignment. (C) Total number of species reported by the MCP for each sample and the number of these species which are uncultured species or Microba MAG-exclusive species. (D) Total percentage of reads assigned by the MCP to genomes in the MGDB and the percentage assigned to isolates, public MAGs/SAGs, or MAGs obtained by Microba. (E) Percent identity of reads mapped by the MCP for 33 US fecal samples and in silico mock communities with decreasing ANI similarity to genomes in the standardized reference database.

