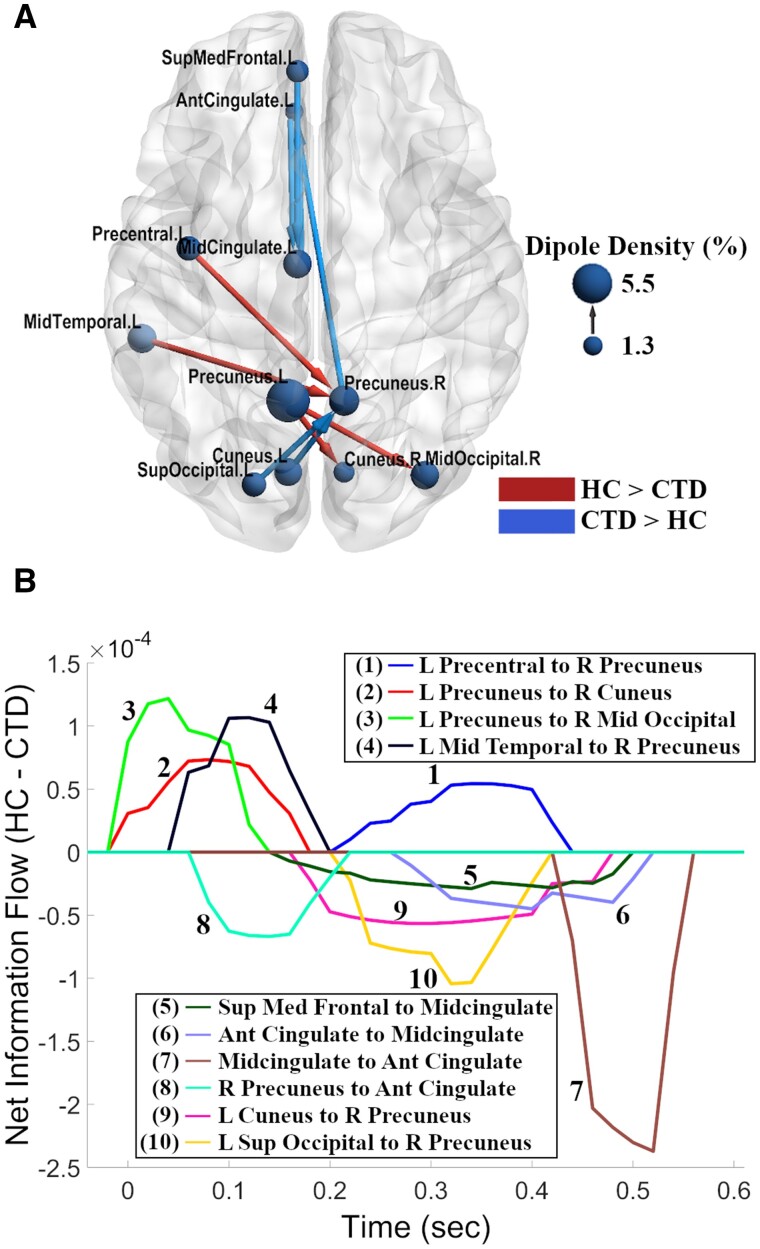
Figure 5.
Network view of effective connectivity during inhibitory control. (A) The chronic tic disorder (CTD) group exhibited greater information flow along the midline and with frontal regions (blue), while greater causal flow among central and posterior regions was observed in the healthy control (HC) group (red). The arrows represent the direction of information flow for a given connection, and node sizes represent dipole density for a given node. The brain model was visualized using BrainNet Viewer software.88 (B) Time series representation of outflow for significant between-group connections from (A). Information flow which is stronger in the HC group is represented by positive values while stronger in the CTD group is represented by negative values. Stimulus onset was at t = 0; mean response time was ∼600 ms, averaged across both groups. Ant, anterior; L, left; Med, medial, R, right; Sup, superior.

