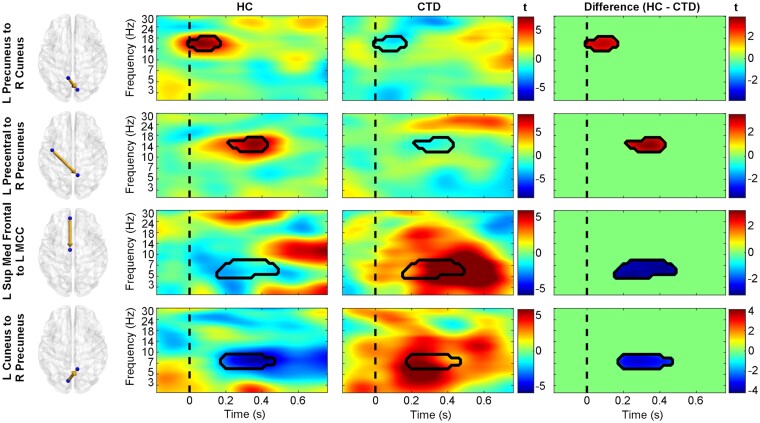
Figure 6.
Diagnostic group differences in causal information flow. Time-frequency plots of effective connectivity patterns (represented as t-statistics) for healthy controls (HC, left), individuals with chronic tic disorder (CTD, middle), and the between-group differences (right). The precuneus in the HC group displayed greater connectivity with the right occipital and left precentral gyrus (red in difference plots), while the CTD group showed greater information flow with frontal and left occipital cortices (blue in difference plots). The dashed line represents stimulus presentation at t = 0. L, left; Med, medial; MCC, midcingulate cortex; R, right; Sup, superior.

