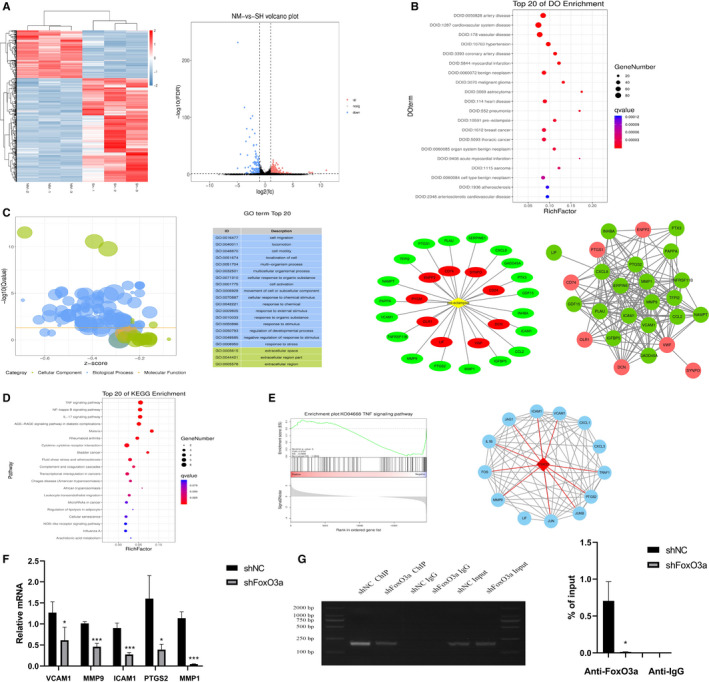
FIGURE 3.

FoxO3a regulates gene expression of HTR8/SVneo cells and ICAM1 transcription. (A) The heat map and Volcano plot illustrate the copy numbers of mRNAs. Red represents higher transcription, and blue represents lower transcription. (B) Disease ontology analysis shows 28 genes relate to pre‐eclampsia. (C) Enriched Gene Ontology (GO) analysis shows migration is the most affected biological process after FoxO3a knockdown in HTR8/SVneo cells. (D) KEGG pathway analysis shows the related pathways. (E) GSEA and protein‐protein interaction (PPI) analysis shows the decreased TNF signalling pathway. (F) qPCR shows reduced expression of the genes downstream of TNF signalling pathway. (G) ChIP‐PCR and ChIP‐qPCR for FoxO3a indicate it binds to the promoter region of ICAM1. Results are shown as mean ±SEM, n = 3, *P < .05, ***P < .001
