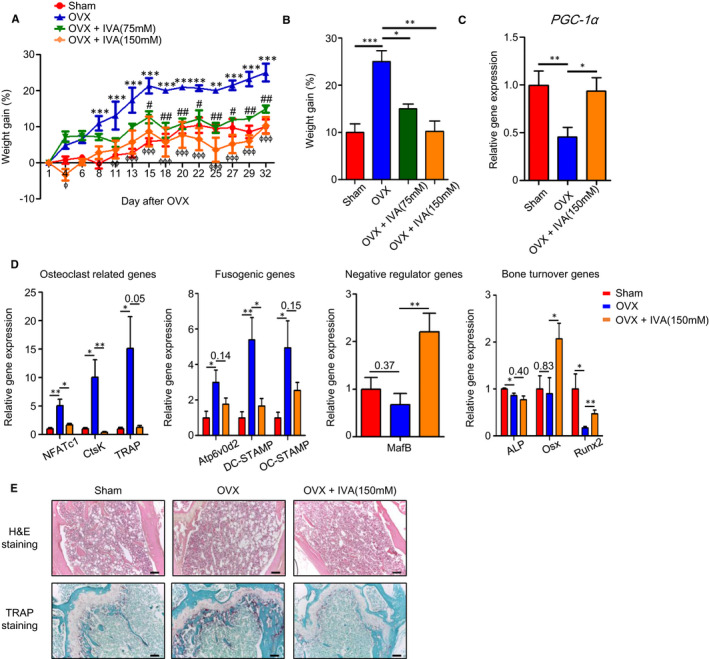
FIGURE 5.

IVA shows therapeutic effects against OVX‐induced osteoporosis. A, B, Weight gain percentage was measured from the sham, OVX, OVX + IVA (75 mM), OVX + IVA (150 mM) groups for 32 days (A) and at the end of the experiment (B). C, D, Mice were sacrificed 5 weeks after OVX surgery. Femurs and tibias were harvested from each group [sham, OVX, OVX + IVA (150 mM)] to prepare RNA. qPCR analyses were performed using specific primers for PGC‐1α (C), OC‐related genes (TRAF6, NFATc1, and CtsK), fusogenic genes (OC‐STAMP, DC‐STAMP and Atp6v0d2), osteoclastogenesis negative regulator genes (MafB), bone turnover markers (ALP, Osx and Runx2) and GAPDH (D). H&E and TRAP histological staining of mouse femurs of sham, OVX, and OVX + IVA mice 5 weeks after OVX surgery (E). Data are presented as the mean ± SEM (n = 4 for A‐D). (A) Two‐way ANOVA: *P < .05, **P < .01, ***P < .001 for sham compared with OVX model, # P < .05, ## P < .01 for OVX compared with OVX + IVA (75 mM), ɸ P < .05, ɸɸ P < .01, ɸɸɸ P < .001 for OVX compared with OVX + IVA (150 mM). (B) One‐way ANOVA: *P < .05, ** P < .01, *** P < .001. (C, D) * P < .05, ** P < .01, *** P < .001. (E top, E bottom) Data are representative of at least three independent experiments. Scale bar; 100 μm
