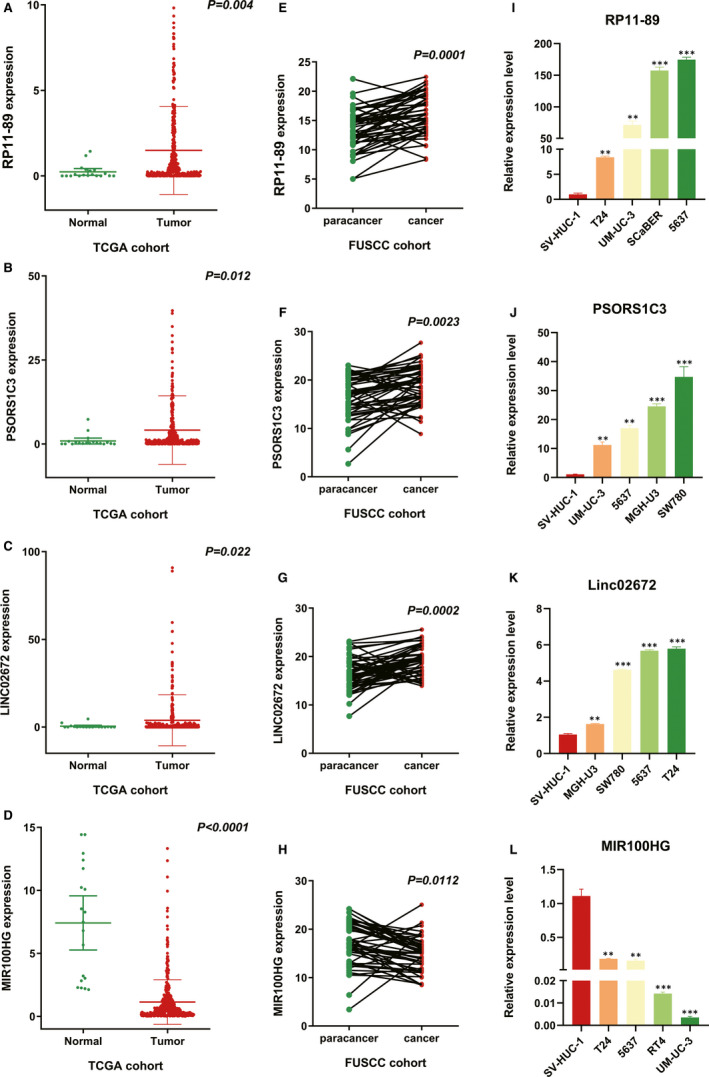
FIGURE 3.

Different expression of RP11‐89, PSORS1C3, MIR100HG, and LINC02672 in BLCA. A‐H, RT‐qPCR was performed to show the expression level of RP11‐89, PSORS1C3, LINC02672 and MIR100HG in tumour samples compared with normal samples (from the TCGA cohort) and in cancer tissues compared with paired para‐cancerous tissues (from the FUSCC cohort). I‐L, The RT‐qPCR results were used to demonstrate the expression level of RP11‐89, PSORS1C3, LINC02672 and MIR100HG in different BLCA cell lines. *P <.05, **P <.01, ***P <.001
