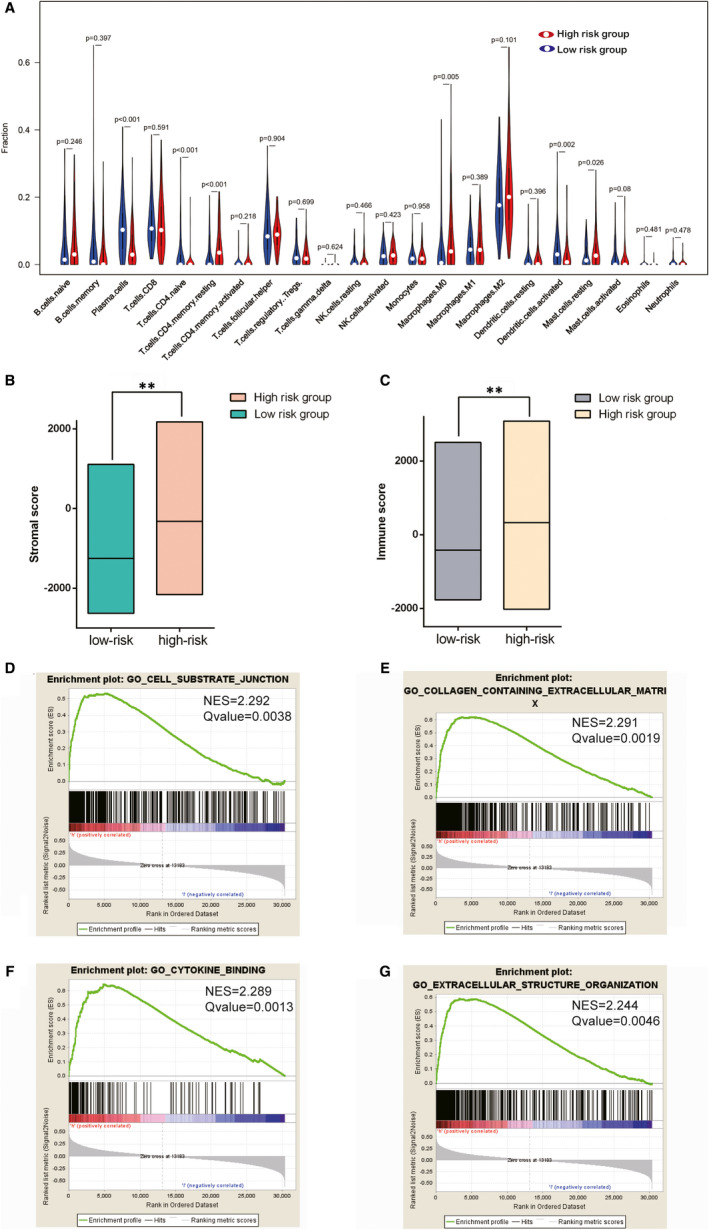
FIGURE 7.

Tumour immune microenvironment and immune‐related pathways were significantly different between the high‐risk group and low‐risk group. A, Violin plots show the distribution of immune cells between the high‐risk group and low‐risk groups. B and C, Different stroma scores and immune scores were indicated between the high‐risk group and low‐risk groups. D‐G, GSEA analysis indicated the functional changes between the high‐risk group and low‐risk group. *P <.05, **P <.01, ***P <.001
