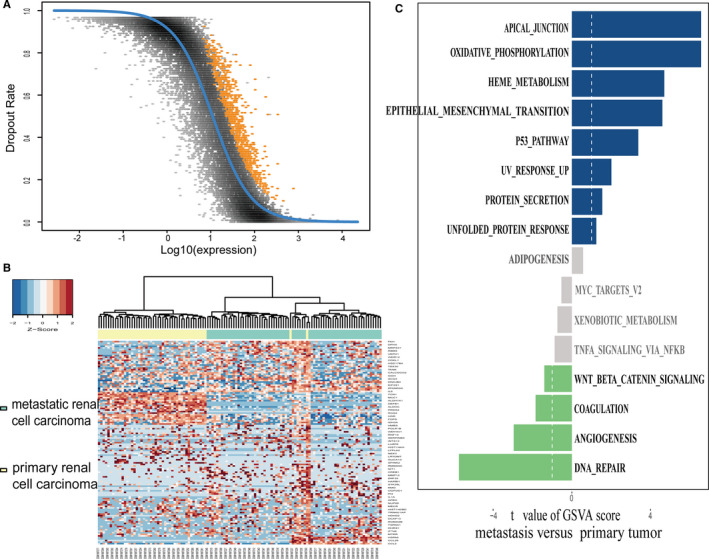
FIGURE 2.

Differential distribution patterns and involved pathways between primary RCC and metastatic RCC. A, A total of 3719 high‐variant genes were identified through the M3Drop R package, and the yellow dots represent the genes with a high dropout rate. Fitting analysis suggests that these genes may be differentially expressed in cell subpopulations. B, Clustering heatmap generated by unsupervised hierarchic clustering reveals that the high‐variant genes discriminate primary RCC from metastatic RCC. C, Differences in pathway activities scored per cell using GSVA between tumour cells isolated from primary RCC or metastatic RCC. t values are independent of effects from the patient of origin
