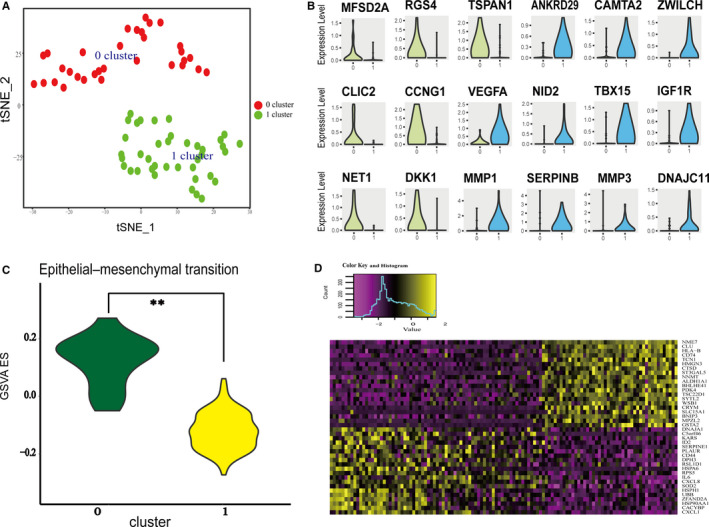
FIGURE 3.

Single‐cell RNA‐seq identified subpopulations from mRCC. A, Cell cluster distribution in mRCC. Two cell clusters were identified and are shown with tSNE maps in cluster 0 and cluster 1 samples, respectively. B, Violin plots of genes showing the highest difference in expression regulation estimates between cluster 0 and cluster 1. C, Violin plots showing the smoothened expression distribution of the cluster‐specific marker genes across the subgroups (GSVA: Gene Set Variation Analysis; ES: enrichment score). D, Heatmap of genes showing the highest difference in expression between cluster 0 and cluster 1
