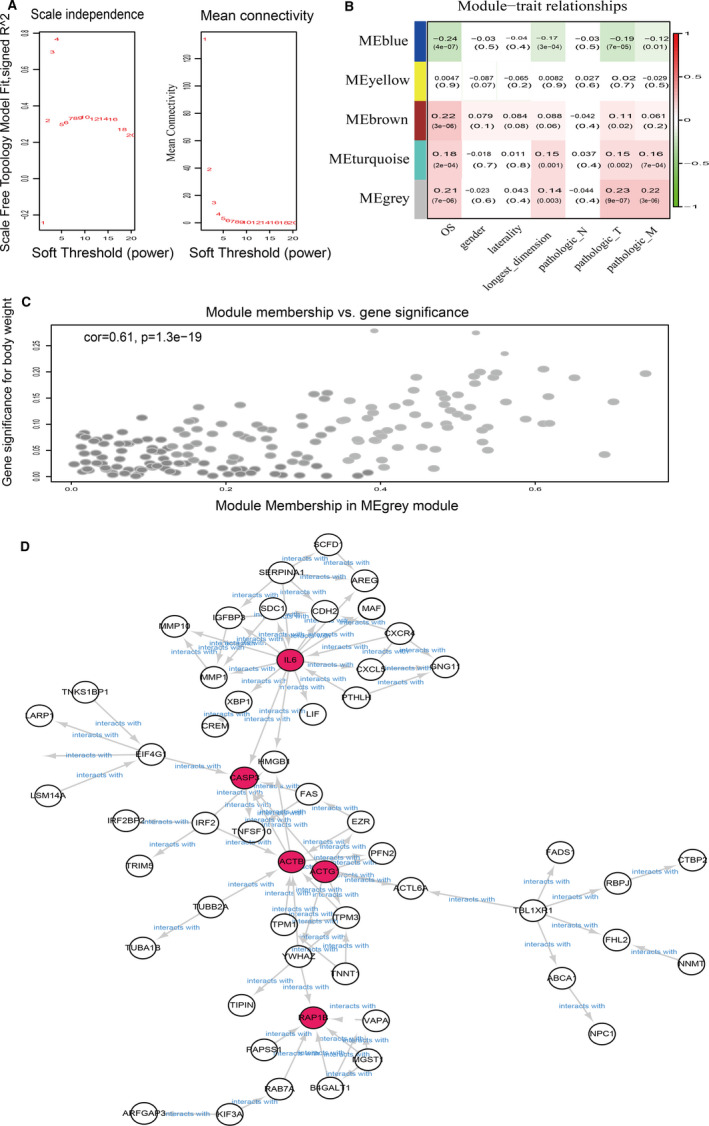
FIGURE 4.

The metastasis‐associated module selection and protein‐protein interaction networks. A, Determination of the soft‐thresholding power in the mRNA WGCNA. B, Module‐trait associations of mRNAs were evaluated by correlations between MEs and clinical traits. Left: Analysis of the scale‐free fit index for various soft‐thresholding powers (β). Right: Analysis of the mean connectivity for various soft‐thresholding powers. C, Scatter plot of the correlation between gene MM in the grey module, which was associated with pathologic metastasis. D, PPI network of DEGs with an interaction score >0.7. Based on STRING and Cytoscape analysis, proteins (the red nodes) with a contribution of greater than six were filtered into the PPI network complex identified as hub genes for the RCC metastatic phenotype, and the red circles were referred to the sub‐dif markers
