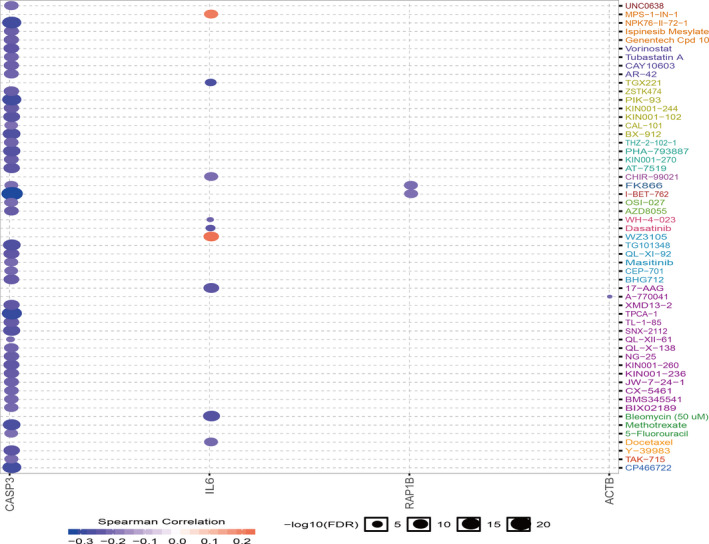
FIGURE 7.

Drug sensitivity analysis of sub‐dif markers in RCC based on the GDSC drug sensitivity database. The Spearman correlation represents the correlation of gene expression with the drug. A positive correlation indicates that high gene expression is resistant to the drug and vice versa
