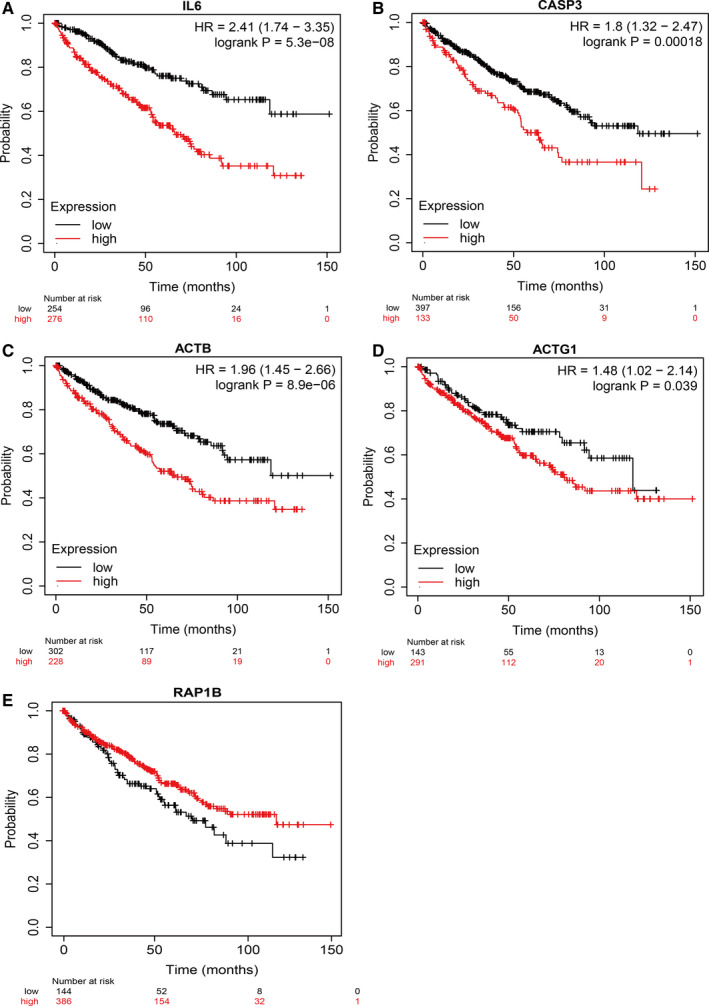
FIGURE 9.

Kaplan‐Meier plot for the survival curve of sub‐dif markers. Kaplan‐Meier survival analysis of tumour samples grouped by gene median expression value c. The sample numbers for each group are shown in brackets. Statistical significance was determined using the log‐rank test (A, IL6; B, CASP3; C, ACTB; D, ACTG1; E, RAP1B)
