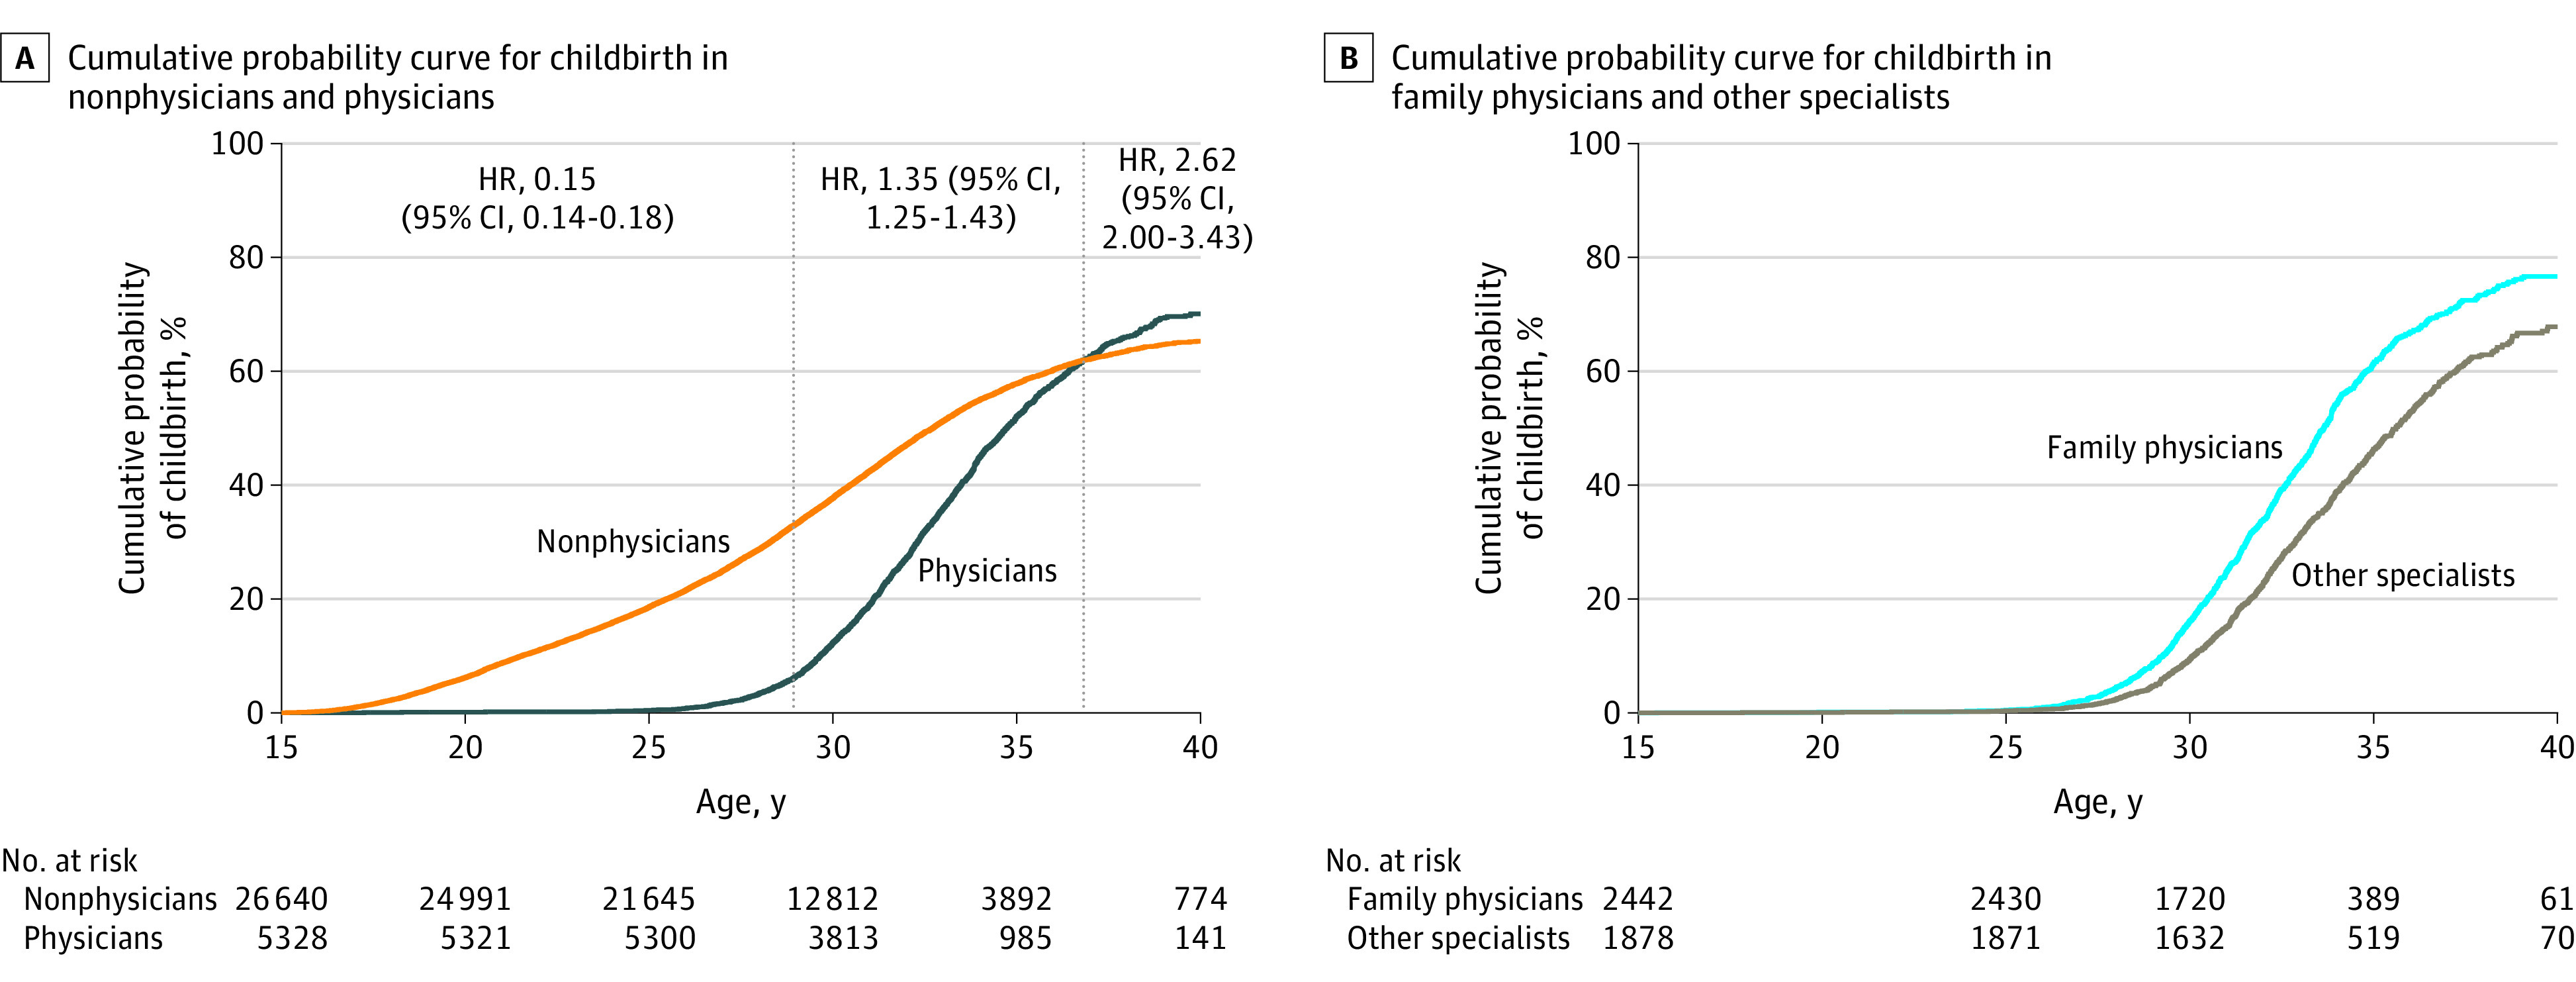
Figure 2. Cumulative Probability Curves for Childbirth .

A, Probability among nonphysicians (n = 26 640) and physicians (n = 5328). B, Probability among family physicians (n = 2442) and other specialists (n = 1878). Age in years serves as the time scale; HR indicates hazard ratio of physicians having children within the indicated age range, with nonphysicians serving as reference [1].
