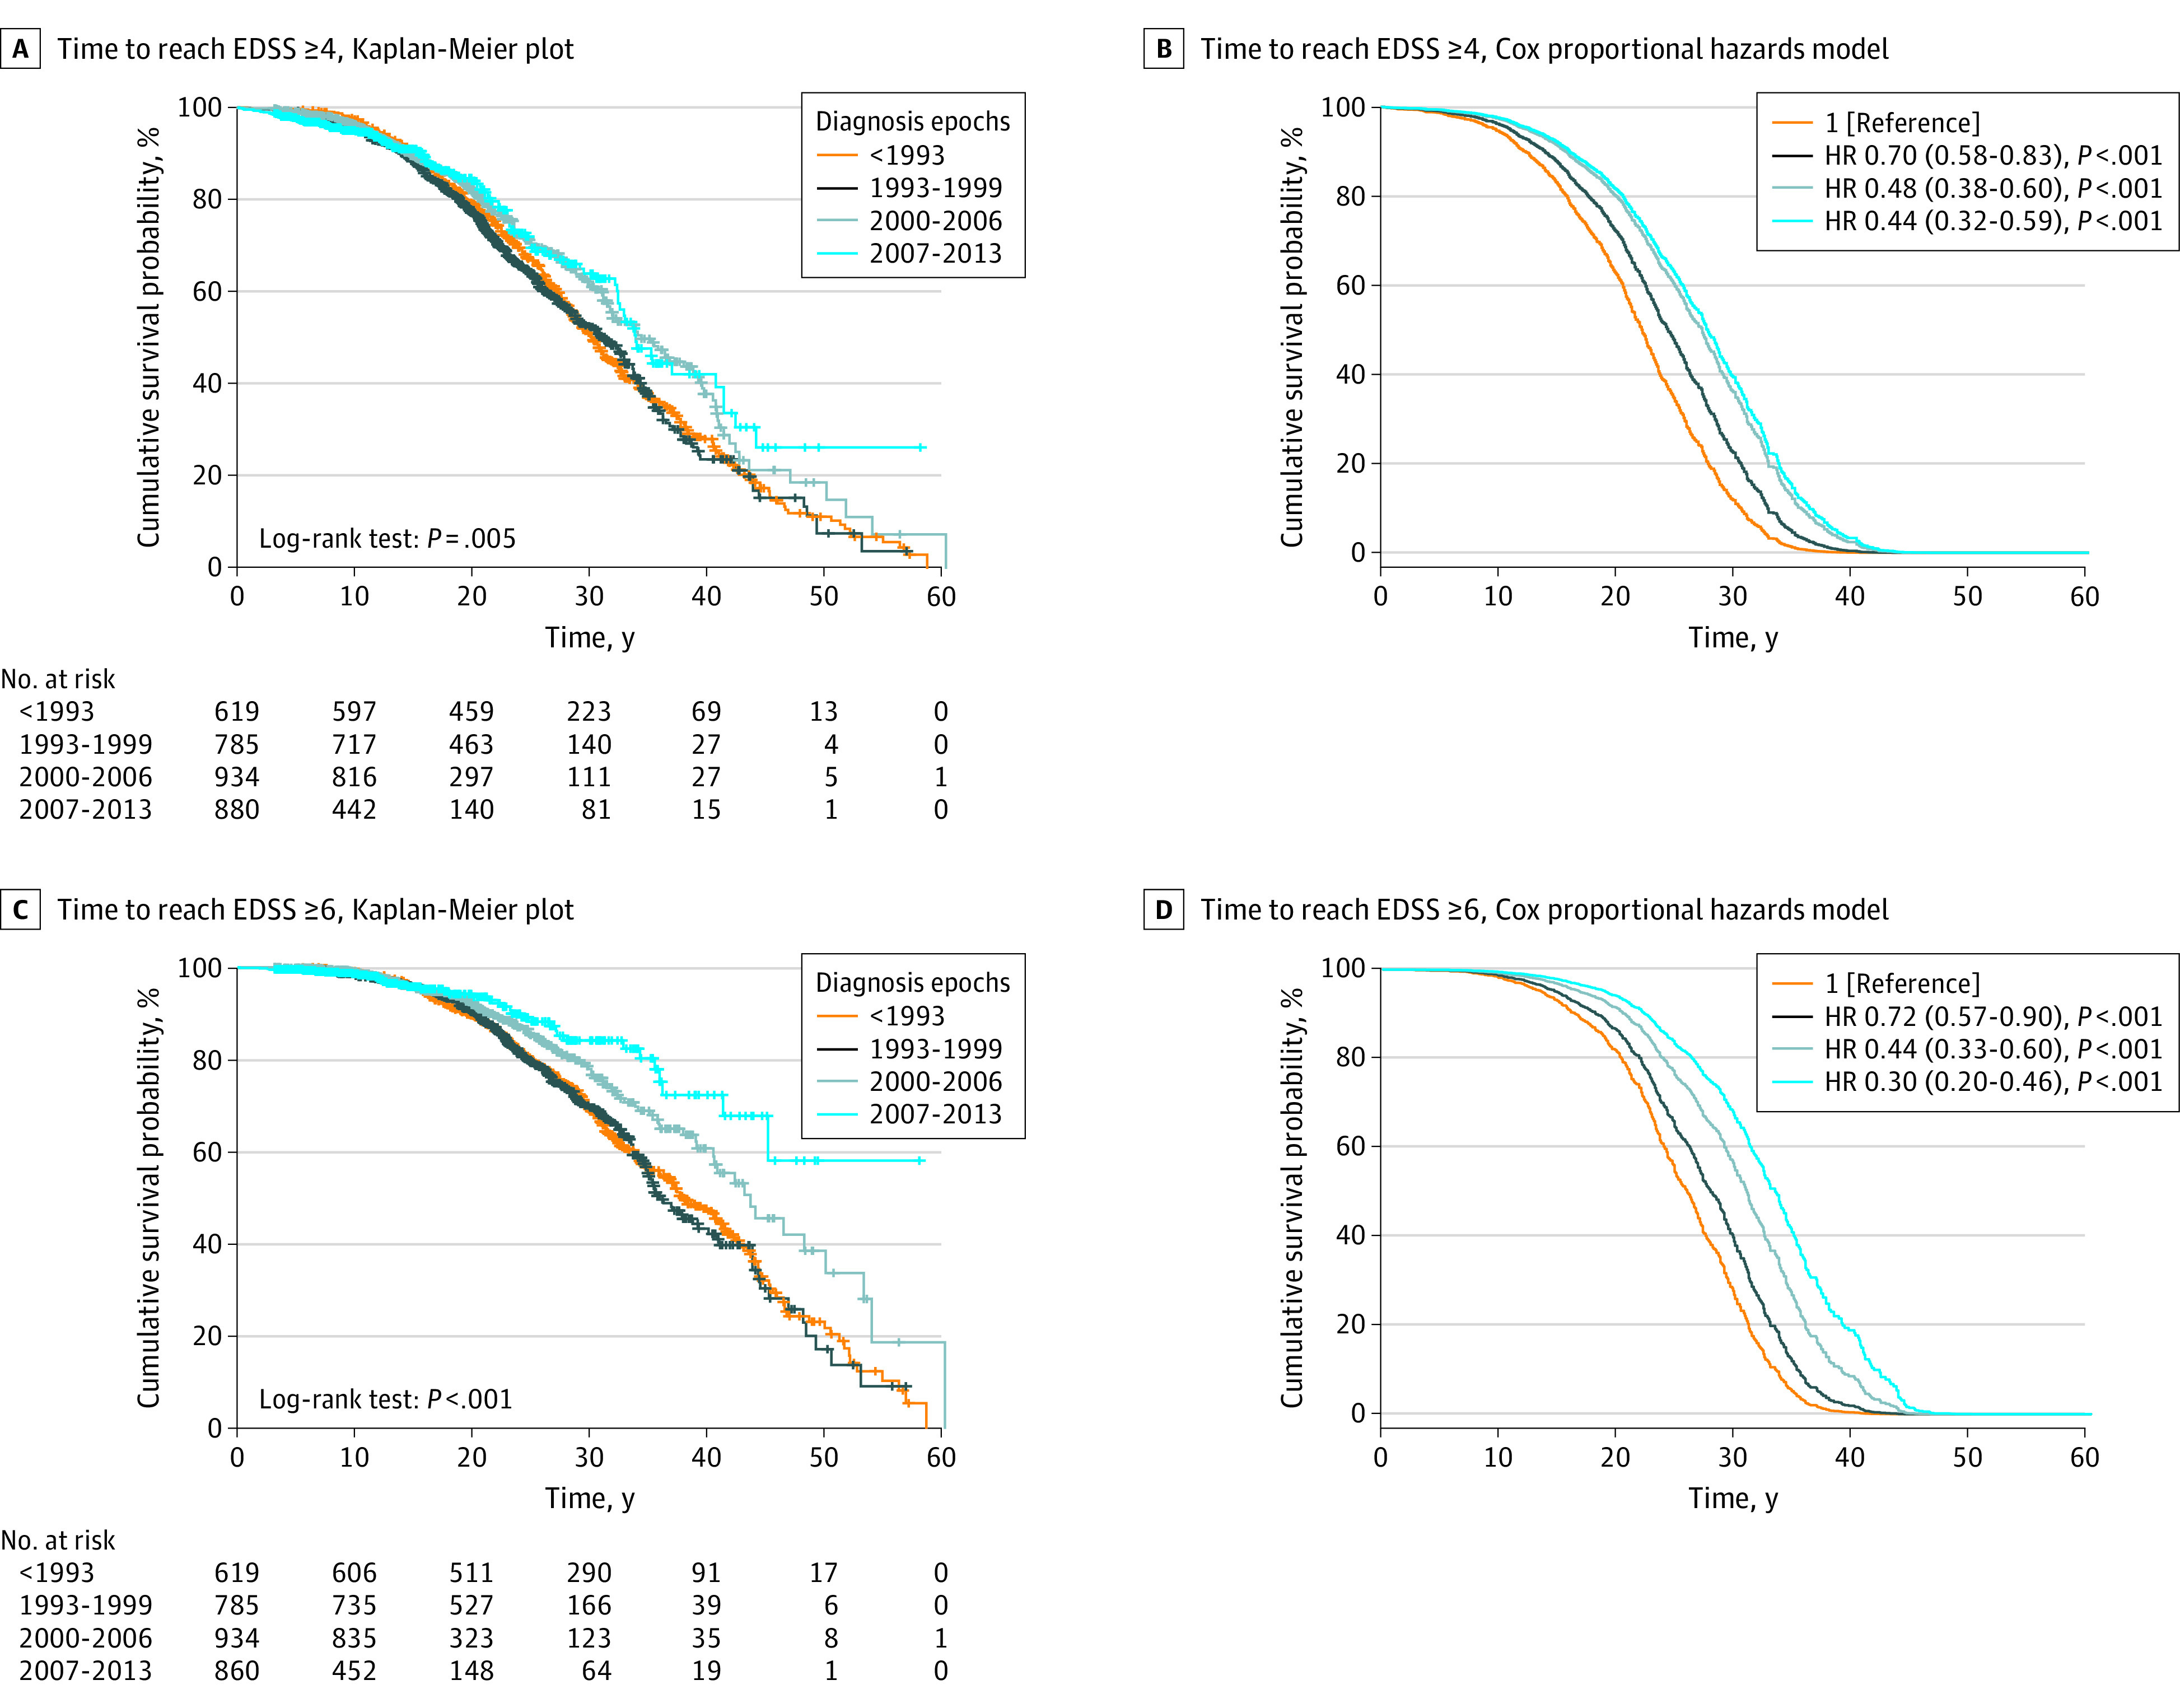
Figure 2. Time to Reach Disability Milestones from MS Onset Compared by Diagnosis Epochs.

A and C, Kaplan-Meier survival plots, stratified by diagnosis epochs. Number of total events (ie, number of patients who reached the Expanded Disability Status Scale [EDSS] milestone) was 1046 (32%) for EDSS score of at least 4 and 628 (20%) for EDSS score of at least 6. B and D, Survival plots derived from the multivariable Cox proportional hazard models (adjusted for EDSS evaluations per year, period of EDSS assessment, disease duration at first EDSS evaluation, age at onset, sex, annualized relapse rate in the first 3 years, type of clinical onset, and time from onset to diagnosis) with hazard ratios (HR) and relative 95% CI. Diagnosis epoch before 1993 was taken as reference.
