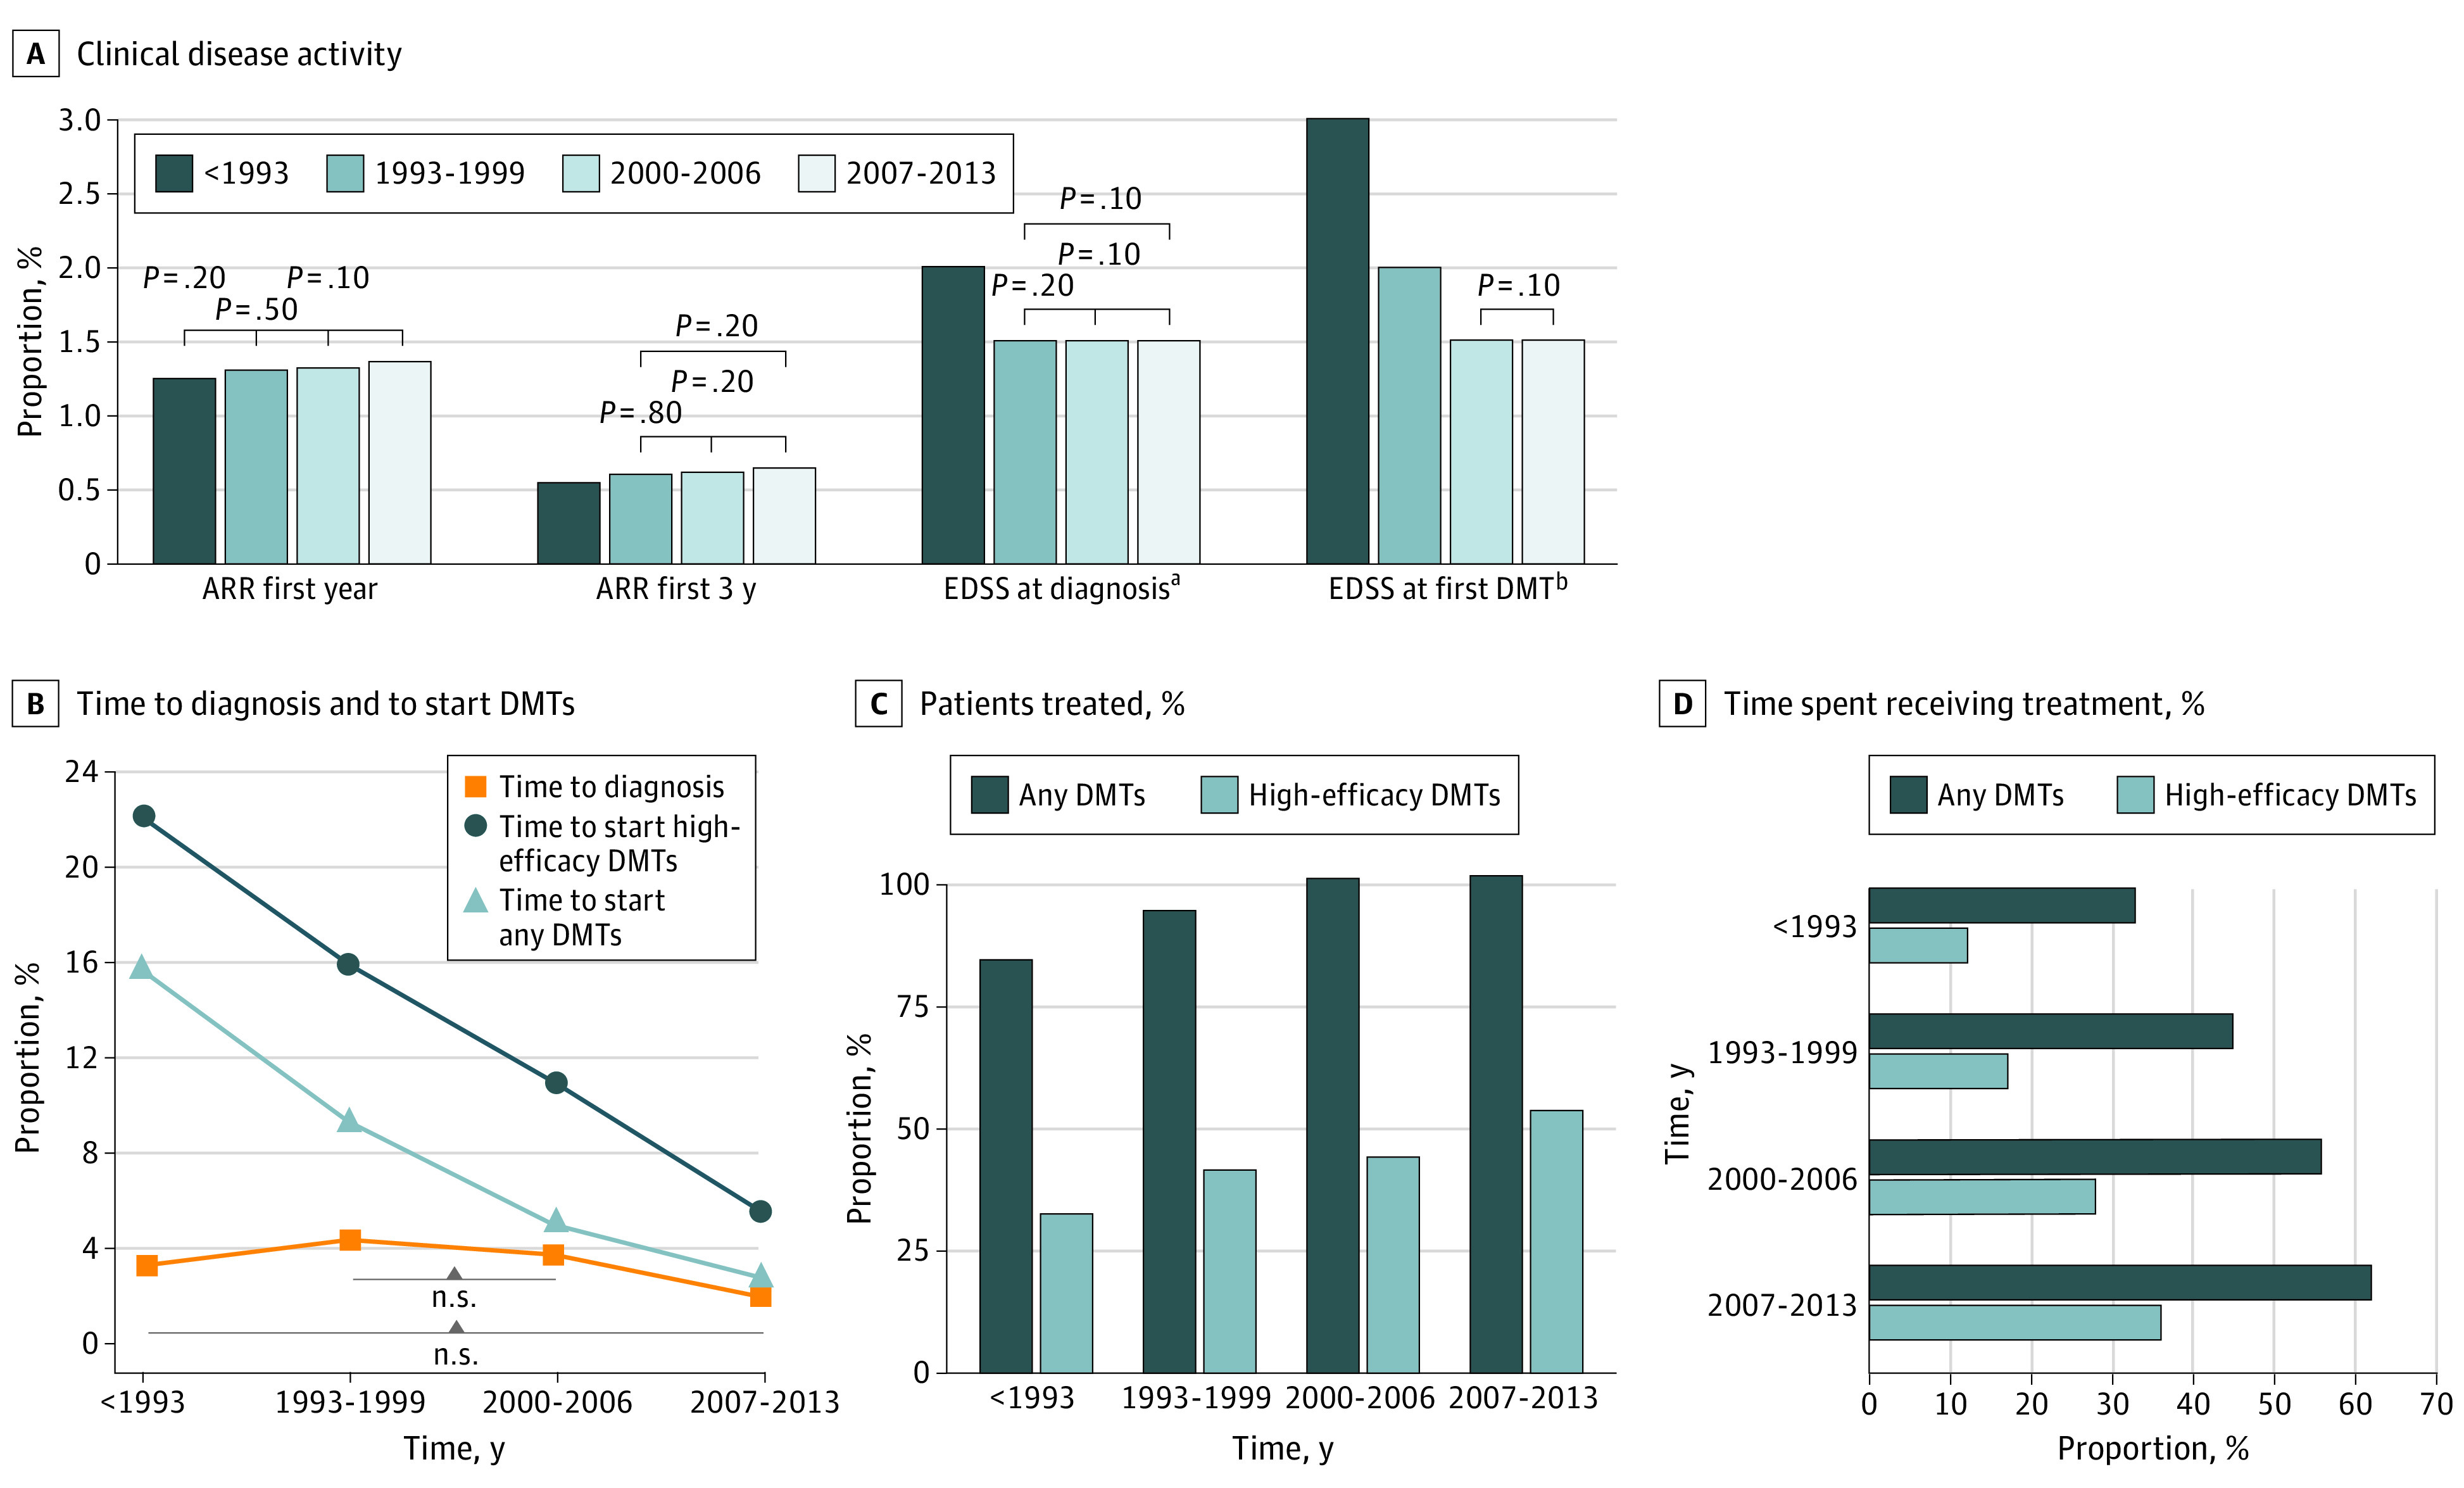
Figure 3. Clinical Disease Activity at Onset, Time to Diagnosis, and Disease-Modifying Therapy (DMT) Management Compared by Diagnosis Epochs.

Annualized relapse rate is expressed as means, number of patients treated as percentage, and all the other variables as medians, including the proportion of time spent taking DMT treatment ([total time taking DMTs/disease duration at last follow-up] × 100). For all the variables reported in the figure, statistical tests used to evaluate the variation among the 4 diagnosis epochs (χ2, analysis of variance, or Kruskal-Wallis test) gave significant results, with P values less than .001. Post hoc tests for multiple comparisons (6 for each variable: χ2, Mann-Whitney, or t test, all corrected by Bonferroni) were all significant (P < .05), except for the comparisons reported as not significant in A and B.
aExpanded Disability Status Scale (EDSS) score evaluated ±6 months from diagnosis; data available on 70 patients (<1993), 261 patients (1993-1999), 473 patients (2000-2006), and 538 patients (2007-2013).
bEDSS score evaluated ±3 months from DMT initiation; data available on 244 patients (<1993), 383 patients (1993-1999), 551 patients (2000-2006). and 550 patients (2007-2013).
