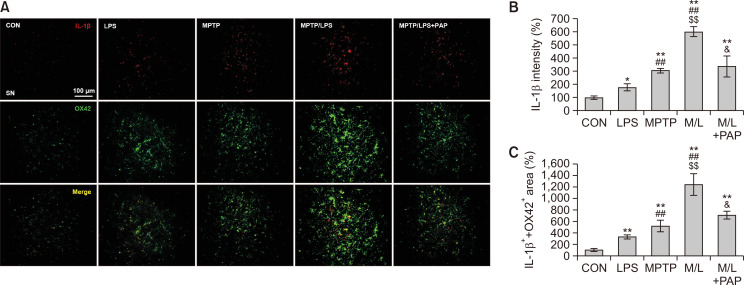
Fig. 3.
PAP reduced IL-1β expression in microglia of MPTP/LPS-treated mice. (A) Photomicrographs of the double fluorescent staining of SN OX42+ and IL-1β+ Particles (N=4 in each group). (B) Quantification of the fluorescent intensity of SN IL-1β+ particles. (C) Quantification of the area of SN OX42+ and IL-1β+ particles. Data are presented as mean ± SEM. *p<0.05, vs. CON; **p<0.01, vs. CON; ##p<0.01, vs. LPS; $$p<0.01, vs. MPTP; &p<0.05, vs. M/L

