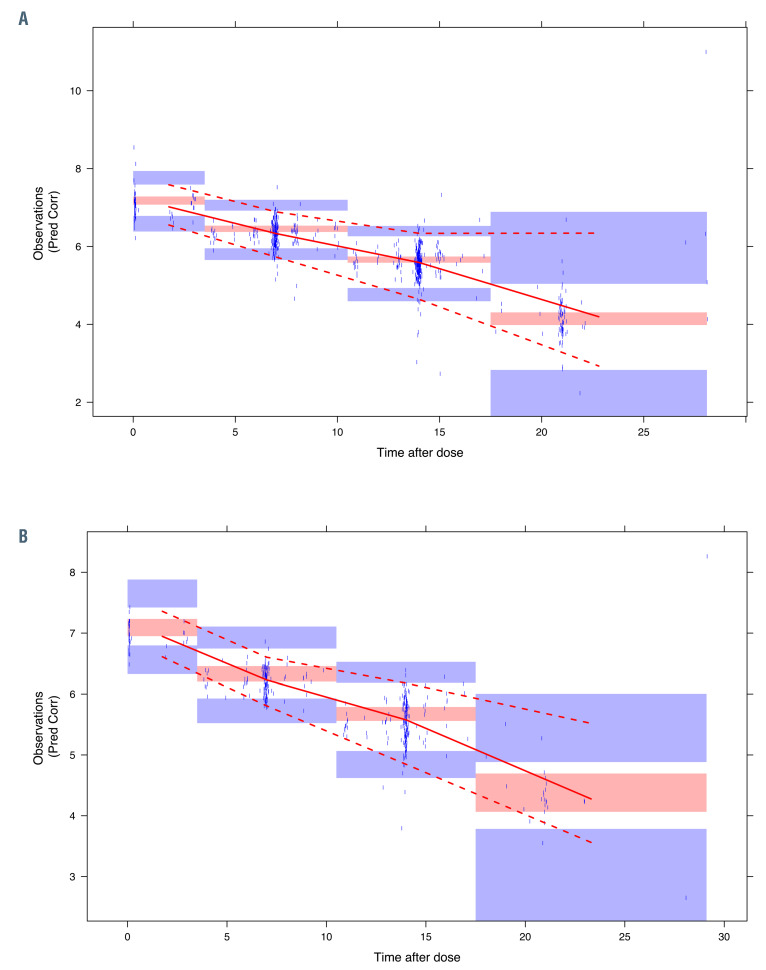
Figure 3.
Visual predictive check. (A) and (B) show the visual predictive checks of the index and validation dataset, respectively. The observations and their corresponding median and 95% Confidence Intervals (CI) are indicated by the points, and the solid and dashed red lines. In both graphs, these lines fall within the 95% CI of the median and 95% CI (red and blue shaded areas) as obtained by simulation.

