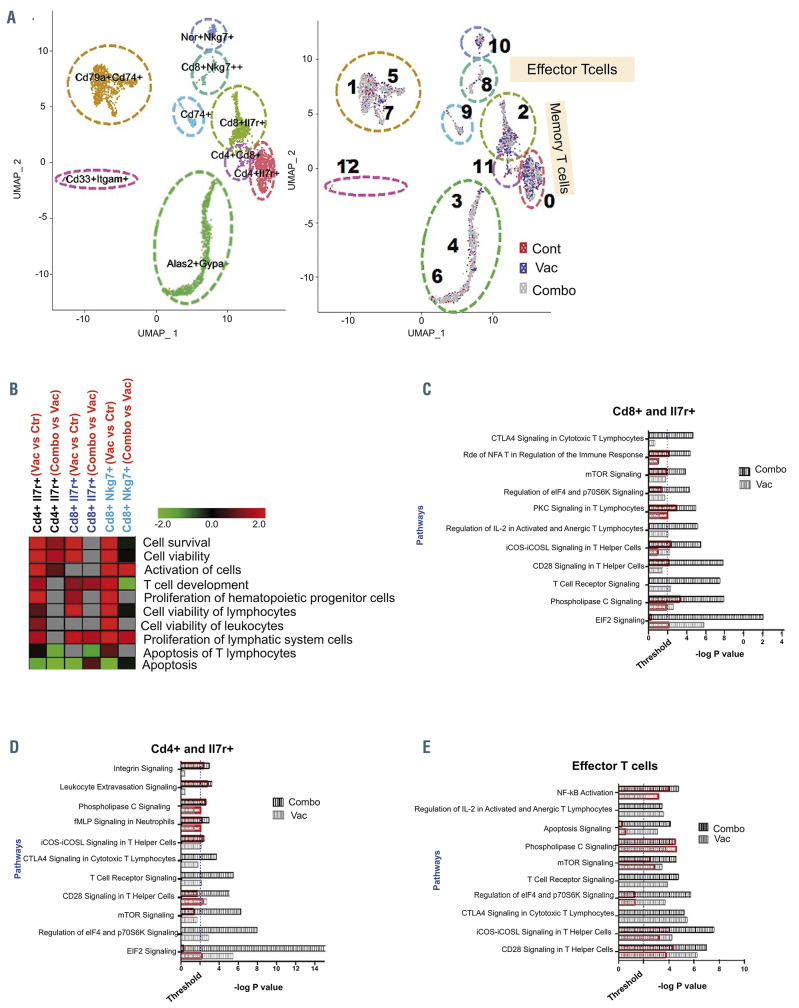
Figure 6.
Single-cell RNA sequencing analysis demonstrates that vaccination alone and in combination with checkpoint inhibition affects the T-cell landscape. (A) Singlecell RNA-sequencing analysis of peripheral blood mononuclear cells isolated from control mice, mice treated with the dendritic cell (DC)/acute myeloid leukemia (AML) fusion vaccine, and mice treated with the vaccine + checkpoint point inhibitors. (n=3 mice/group). Visualization of single-cell clusters was achieved using the UMAP approach from normalized data of 710 control, 884 vaccine-treated and 1,489 combination-treated peripheral blood mononuclear cells. Cell clusters were annotated based on expression of established immune-cell markers (e.g., T cells [CD3+], B cells [CD19+], memory T cell [Il7r+], and effector cells [Sell+, CD62L–] (left panel). Relative proportions of cells in the clusters from each cohort are depicted with different colors (right panel). (B) Functional enrichment heatmap depicting increased (red) or decreased (green) functional categories in the samples from animals treated with vaccine alone or the combination (combo). The heatmap was prepared based on zscores calculated using ingenuity pathways analysis systems. (C-E) Pathways that are significantly affected in various subsets of memory T cells: CD8a and Il7r+ T cells (C), CD4 and Il7r+ T cells (D), and effector T cells (E). Black and gray bars represent the significance of the impact of vaccine alone and in combination with checkpoint inhibition, respectively, on selected signaling pathways. The extent of activation/increase of various significantly affected pathways is shown using overlapping orange bars.

