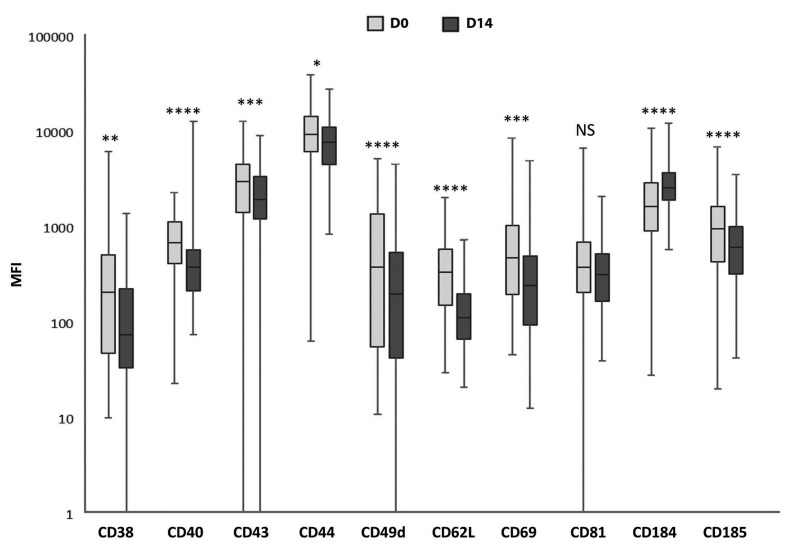
Figure 1.
Effects of ibrutinib plus rituximab in vivo treatment on the expression of chronic lymphocytic leukemia cell adhesion molecules, chemokine receptors and activation markers. Box plots show the comparison between the expression levels for each of the antigens analyzed on primary leukemic B cells before and after 14 days of in vivo treatment with ibrutinib plus rituximab. Data are presented as mean fluorescent intensity values obtained with specific monoclonal antibodies compared with values given by isotype controls. Significant differences are indicated as ****P<0.00001, ***P<0.0001, **P<0.001, *P<0.01; NS: not significant (paired Student t-test). D0: before treatment, D14: after 14 days of treatment; MFI: mean fluorescent intensity.

