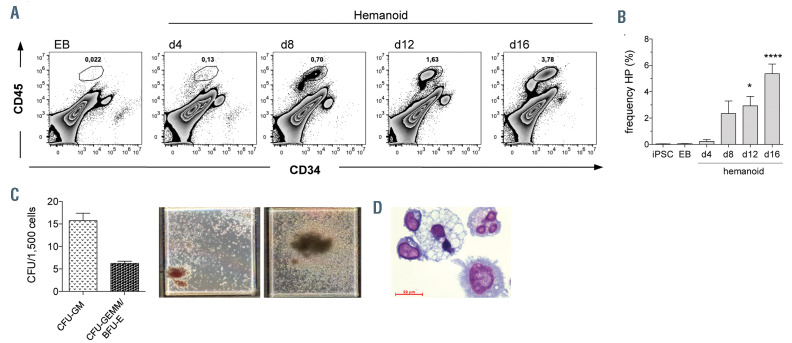
Figure 4.
Characterization of hematopoietic progenitors within hemanoids. (A and B) Frequency of CD34+CD45+ hematopoietic progenitors (HP) at different days of hematopoietic specification. (A) Representative flow cytometry data (percentage of gated population is indicated) and (B) quantification of n=4, mean±standard error of the mean (SEM). (C) Left: Frequency of colony-forming unites (CFU) of fluorescence-activated cell sorting-purified HP (mean±SEM, n=4, two biological and two technical replicates) and right: bright field microscopy of colony forming units (CFU) in methylcellulose. (D) Representative cytospin staining of CFU from HP derived from the clonogenic assay (scale bar: 20 mm). *P<0.05, ****P<0.0001; statistical significance was assessed using one-way ANOVA with the Dunnetts multiple comparison test.

