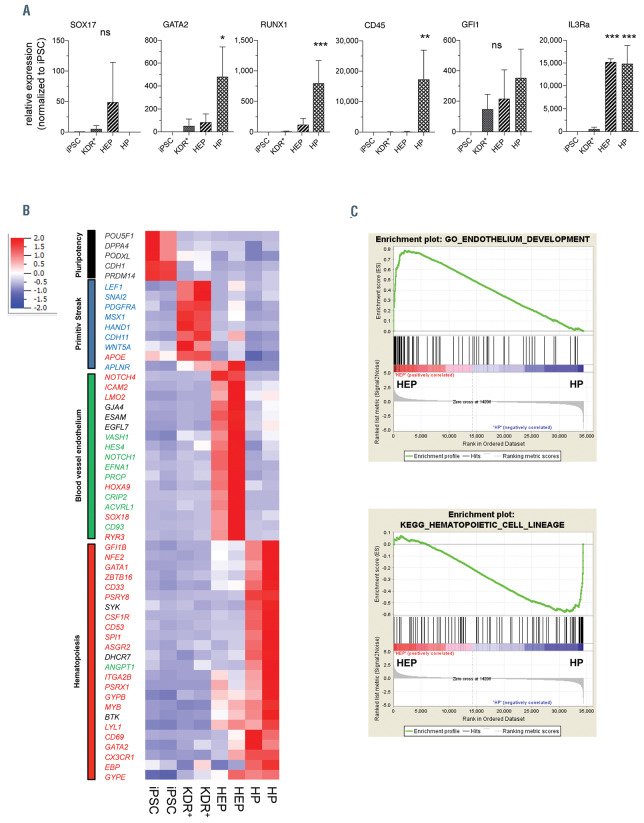
Figure 6.
Whole transcriptome analysis. Fluorescence-activated cell sorting (FACS)-purified Tra-1-60+ pluripotent induced pluripotent stem cell (iPSC), Tra-1-60- /KDR+ mesodermal progenitor cells derived from embryoid bodies (EB), CD34+/CD144+/CD45– hemato-endothelial progenitor (HEP) and CD34+/CD144– /CD45+hematopoietic progenitors (HP) derived from the hemanoids were analyzed by microarray analysis. (A) Expression analysis of selected genes (SOX17, GATA2, RUNX1, CD45, GFI1 and IL3RA) in FACS-purified populations by quantitative real time polymerase chain reaction (qRT-PCR) (n=3, mean±standard error of the mean [SEM]). (B and C) Analysis of whole transcriptome data. (A) Heatmap analysis of selected GO (pluripotency: black, primitive streak: blue, blood vessel endothelium: green, hematopoiesis: red). (C) Gene set enrichment analysis of HEP and HP. Upper panel: GO Endothelium development (normalized enrichment score [NES]=2.89, P<0.001, false discovery rate [FDR]<0.01, lower panel: KEGG hematopoietic cell lineage (NES=-1.99, P<0.001, FDR<0.01). *P<0.05, ****P<0.0001; statistical significance was assessed using one-way ANOVA with the Dunnetts multiple comparison test.

