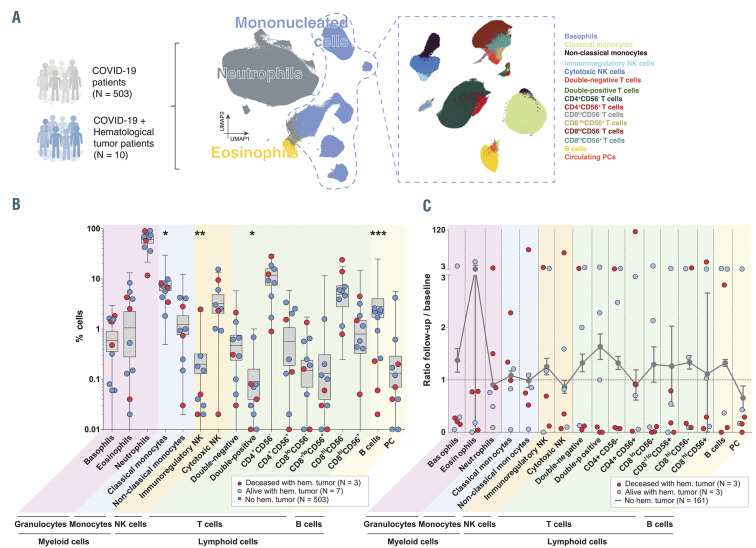
Figure 1.
Immune response in COVID-19 patients and hematological cancer patients. (A) Schematic representation of semi-automated analysis of flow cytometric data and clustering of 17 immune cell types systematically identified in a total of 513 patients diagnosed with coronavirus disease 2019 (COVID-19). (B) Relative distribution of immune cell types in COVID-19 patients with (n=10, dots) and without (n=503, boxes) blood cancer. (C) Ratio between the percentage of each immune cell type at last follow-up and presentation in COVID-19 patients with (n=6, dots) and without (n=161, line) hematological tumor. Blue dots indicate alive patients and red dots represent deceased patients. Dashed line represents no variation over time (ratio = 1).*P<0.05; **, P<0.01; ***P<0.001. PC: plasma cells. : NK: natural killer cells.

