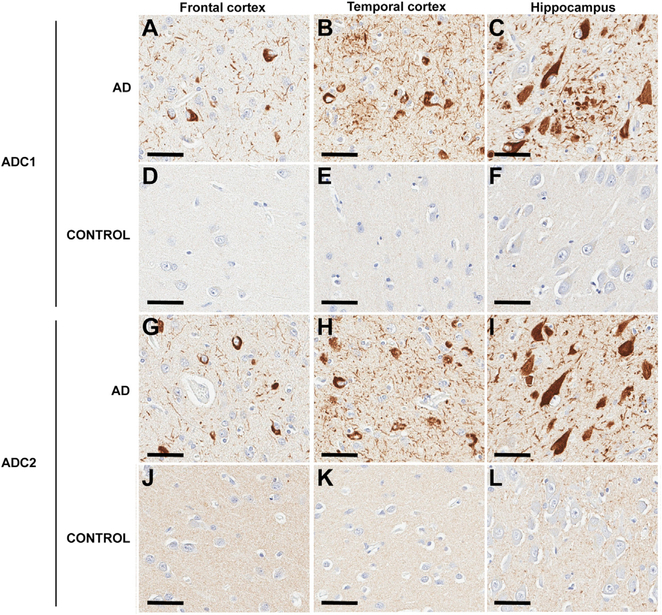
Figure 2. AD tau core antibodies detect AD pathology.
(A–L) Immunohistochemical analysis with the AD core 1 (ADC1; A–F) and AD core 2 (ADC2; G–L) antibodies in paraffin-embedded tissue sections from a control (D–F and J–L) and AD (A–C and G–I) case. Representative images are presented from the frontal cortex (A, D, G, and J), temporal cortex (B, E, H, and K), and hippocampus (C, F, I, and L) as indicated. Nuclei are counterstained with hematoxylin. Scale bar represents 50 μm.

