Figure 5.
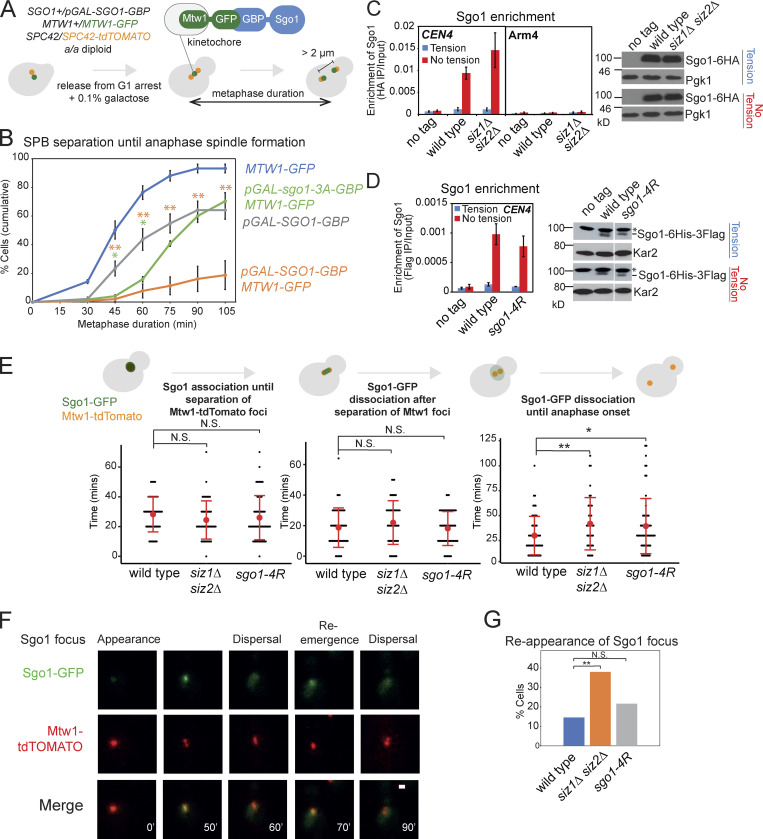
Sgo1 is released under tension in the absence of SUMOylation but reassociation is increased in siz1Δ siz2Δ. (A and B) Tethering Sgo1 to the kinetochore component Mtw1 delays anaphase onset. (A) Scheme of the experiment. Live-cell imaging was performed in an a/a diploid synchronized by release from G1. Low overexpression of pGAL-SGO1-GBP was induced with 0.1% galactose. Metaphase duration was estimated as the time between the emergence of two Spc42-tdTOMATO dots until they separated >2 µm apart. (B) Metaphase duration was measured in the following strains: MTW1-GFP (AMy26682), pGAL-SGO1-GBP (AMy26679), pGAL-SGO1-GBP MTW1-GFP (AMy26568), and pGAL-sgo1-3A-GBP MTW1-GFP (AMy26570) cells carrying SPC42-tdTOMATO. Shown are the average values of three to four independent experiments, with error bars representing standard errors. Statistics: two-tailed Student’s t test comparing to the pGAL-SGO1-GBP strain (*, P < 0.05; **, P < 0.01). (C) SUMOylation is not required for bulk Sgo1 dissociation from the pericentromeres under tension. No tag control (AMy2508), SGO1-6HA (AMy6390), and siz1Δ siz2Δ SGO1-6HA (AMy8115) cells carrying pMET-CDC20 were arrested in metaphase in the presence (DMSO) or absence (benomyl/nocodazole) of spindle tension, and Sgo1 association with the indicated site was measured by ChIP-qPCR. Shown are the average values of three independent experiments, with error bars representing standard errors. Metaphase-arrested siz1Δ siz2Δ cells showed a level of Sgo1 similar to wild-type cells. Protein extracts were analyzed by anti-HA or loading control (Pgk1) immunoblots. (D) Sgo1-4R shows similar localization to wild-type Sgo1. Sgo1 association with CEN4 was measured by ChIP-qPCR using SGO1-6HIS-3FLAG (AMy25141) and sgo1-4R-6HIS-3FLAG (AMy26696) strains carrying pMET-CDC20. The experiment was performed as described in C. Metaphase-arrested sgo1-4R cells showed a level of Sgo1 similar to wild-type cells. Protein extracts were analyzed by anti-Flag or loading control (Kar2) immunoblots. The nonspecific bands are marked with an asterisk. (E–G) Evaluating Sgo1 localization and dynamics in the SUMO mutants. Wild-type (AMy9233), siz1Δ siz2Δ (AMy15604), and sgo1-4R (AMy23811) strains carrying pMET-CDC20, SGO1-yeGFP, and MTW1-tdTOMATO were grown in methionine dropout medium, followed by live-cell imaging. At least 50 cells from two independent experiments were analyzed for each strain. (E) siz1Δ siz2Δ and sgo1-4R delay in metaphase after the initial bulk Sgo1 removal from the pericentromere. Anaphase onset was estimated as the time when the two Mtw1-tdTOMATO dots were >2 µm apart. Error bars represent standard deviation, with the red dots indicating mean values. Statistics: two-tailed Student’s t test (*, P < 0.05; **, P < 0.01; N.S., not significant). (F) Representative image of reemerged Sgo1 focus after its initial dispersal. Images were acquired as described in Materials and methods and were maximum-intensity projected for Sgo1-GFP and Mtw1-tdTOMATO. Scale bar = 1 µm. (G) The occurrence of Sgo1 focus reemergence increased in siz1Δ siz2Δ. Statistics: Fisher’s exact test (**, P < 0.01).

