Figure 9.
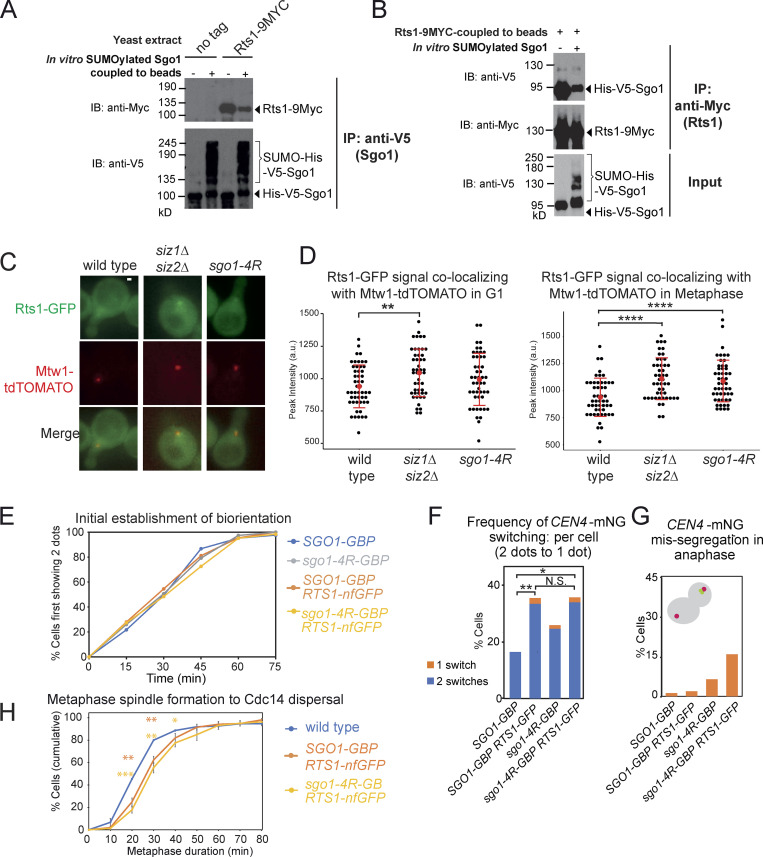
SUMOylation blocks Rts1 binding to Sgo1, and release of this interaction is important for stable biorientation. (A) SUMOylated Sgo1 has reduced binding affinity for Rts1. Recombinant V5-tagged Sgo1 was mixed with components of the SUMOylation pathway in the presence or absence of ATP. Anti-V5 antibody coupled to Protein G Dynabeads was added to the mixture, washed thoroughly, and incubated with extract from sgo1Δ (AM827) or sgo1Δ RTS1-9MYC (AMy8832) cells. Levels of Sgo1 and Rts1 bound to beads were probed by anti-V5 and anti-Myc Western blotting, respectively. IB, immunoblot. (B) Rts1 preferentially binds to unSUMOylated Sgo1. Rts1-9Myc was immunoprecipitated from sgo1Δ RTS1-9MYC (AMy8832) using anti-Myc antibody coupled to Protein G Dynabeads. Beads were incubated with in vitro SUMOylation reaction mixture containing Sgo1. Levels of Sgo1 and Rts1 bound to beads were probed by anti-V5 and anti-Myc Western blotting, respectively. (C and D) The kinetochore-proximal pool of Rts1 was increased in the absence of SUMOylation in metaphase. Strains used carried Rts1-GFP and Mtw1-tdTOMATO and were wild type (AMy29076), siz1Δ siz2Δ (AMy29074), and sgo1-4R (AMy29083). Measurements were made in shmooing cells (G1) or right before the emergence of two Mtw1-tdTOMATO kinetochore foci (metaphase). (C) Representative images of Rts1-GFP and Mtw1-tdTOMATO signals from the same z-positions. Images were acquired as described in Materials and methods. Scale bar = 1 µm. (D) Quantification of Rts1-GFP peak intensity that occupied the same area as the kinetochore (Mtw1-tdTOMATO). ImageJ was used to measure the intensities. For each cell, the area occupied by the kinetochore was selected by outlining the boundaries of Mtw1-tdTOMATO signals. The same area in the same z-slice was restore selected in the Rts1-GFP channel, the peak green value was measured, and background was subtracted. 48 cells from two independent experiments were analyzed for each strain. Red dots represent mean values, and error bars represent standard deviation. Statistics: one-tailed Student’s t test (**, P < 0.01; ****, P < 0.0001). (E–G) Forced interaction between Rts1 and Sgo1 destabilizes biorientation. Strains used carry CEN4-mNeonGreen pMET-CDC20 and SPC42-tdTOMATO and were SGO1-GBP (AMy28389), SGO1-GBP RTS1-nonfluorescent GFP (AMy28092), sgo1-4R-GBP (AMy28417), and sgo1-4R-GBP RTS1-nonfluorescent GFP (AMy28416). The assay was performed as described in Fig. 6 D. (E) Tethering Rts1 to wild-type Sgo1 or Sgo1-4R does not affect the initial establishment of biorientation. (F) Increased reassociation of CEN4-mNeonGreen dots was observed when Rts1 was tethered to wild-type Sgo1 or Sgo1-4R. At least 50 cells from two independent experiments were analyzed for each strain. Shown are the percentages of cells with the indicated number of switchings from two CEN4-GFP dots back to one dot. Statistics: Fisher’s exact test (*, P < 0.05; **, P < 0.01; N.S., not significant). (G) Missegregation is modestly increased when Rts1 is tethered to wild-type Sgo1 or Sgo1-4R. (H) Tethering Sgo1 to Rts1 mildly delays metaphase. Strains used carried CDC14-mRuby YFP-TUB1 and were wild type (AM29672), SGO1-GBP-3MYC RTS1-nfGFP (AM29711), and sgo1-4R-GBP-3MYC RTS1-nfGFP (AM29715). Shown are the average of three independent experiments, and error bars represent standard error. Statistics: one-tailed Student’s t test comparing to the wild-type strain (*, P < 0.05; **, P < 0.01; ***, P < 0.001).

