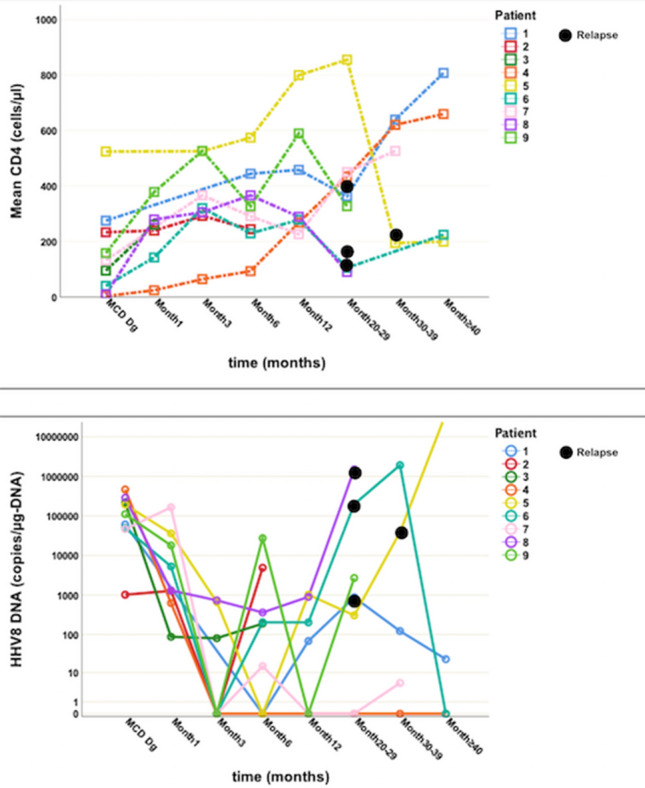
Fig. 1.

Evolution of CD4 cell count (above) and HHV-8 DNA viral load in whole blood (below) after Multicentric Castleman’s Disease (MCD) diagnosis. The HHV-8 DNA viral load is displayed using a logarithmic scale. The time axis is represented using a non-linear scale. Relapses are marked with black dots. Dg Diagnosis
