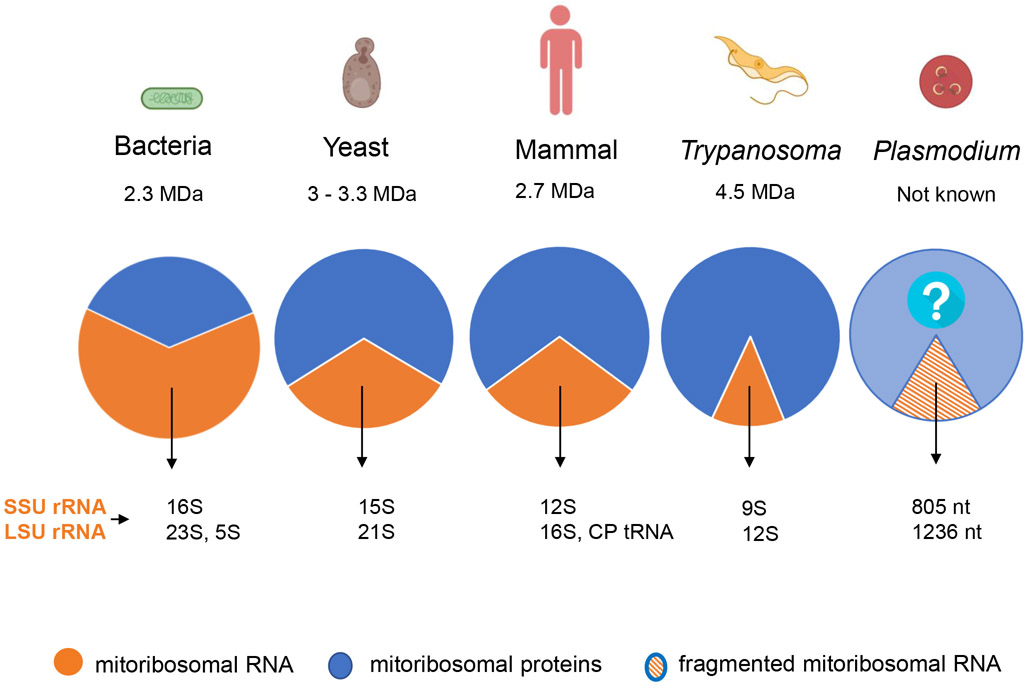
Figure 1. A 2D Pie Chart Showing a Pattern Followed in the Evolution of Mitoribosomes.
Mitoribosomes have a reduced rRNA content (orange), increased protein content (blue), and an overall increase in the size and complexity of the mitoribosomal complex, Plasmodium contains fragmented rRNA (orange stripes), Complete data on Plasmodium mitoribosomal proteins is unavailable (light blue with question mark), The ratio of rRNA to protein was calculated weight to weight, The rRNA-to-protein ratio in Plasmodium is unknown. Note that mitoribosomes of plants are not discussed here, Abbreviations: CP, central protuberance; LSU, large subunit; SSU, small subunit.

