
Figure 6.
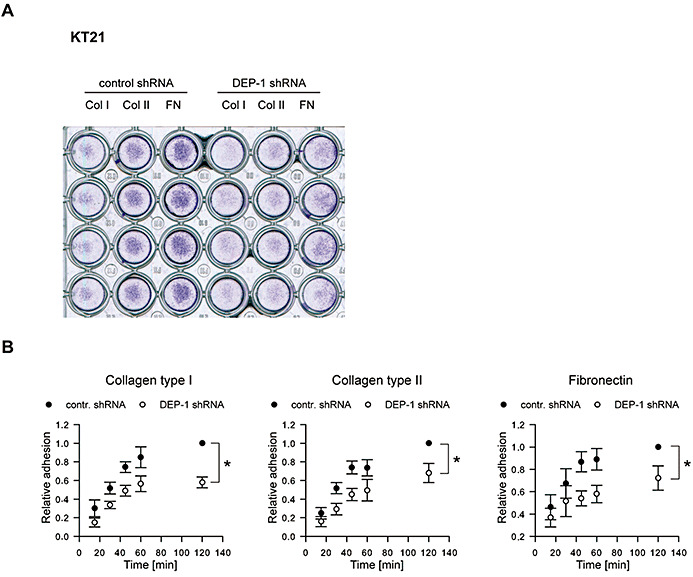
Impaired adhesion of DEP‐1‐depleted cells. A. KT21 cells stably transfected with DEP‐1‐targeting or with control shRNA expression constructs were starved in suspension and seeded in a 96‐well plate coated with collagen type I, collagen type II or fibronectin. After 2 h, medium and non‐adherent cells were removed, adherent cells were washed with PBS and stained with crystal violet. The image was taken by scanning the plate. A representative example is shown. B. KT21 cells and SF3061 cells stably transfected with DEP‐1‐targeting or control shRNA expression constructs were fluorescently labeled with CellTracker™ Green CMFDA and starved for 1 h in suspension before they were seeded in 96‐well plates coated with the indicated matrix proteins. At different time points, non‐adherent cells were removed, adherent cells were lysed and the fluorescence of the lysates was determined. Measurements were performed in six replicates; fluorescence was normalized to the 120 minute value of the control shRNA transfected cell line. Graphs display mean ± SEM of four independent experiments; two‐way ANOVA and Bonferroni's multiple comparison test was applied to test for significant differences between the two cell lines (*P < 0.05).