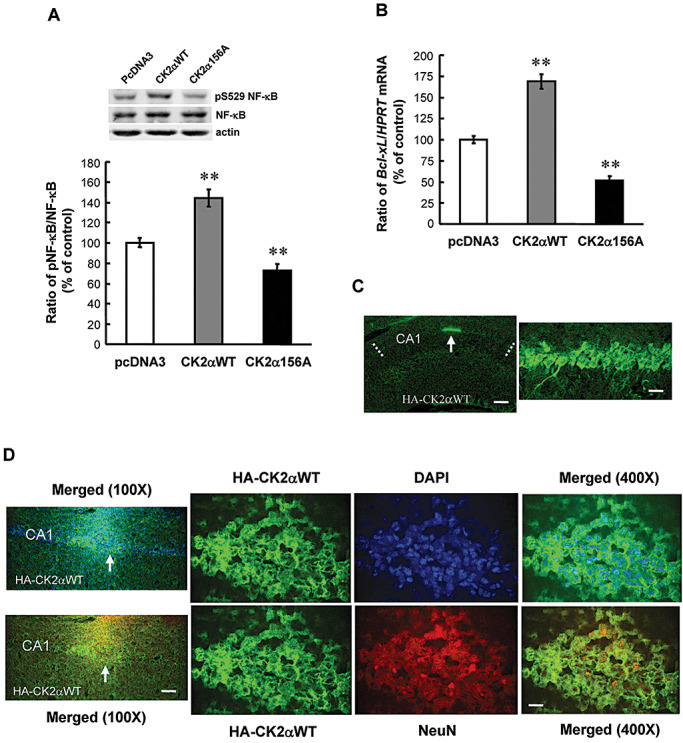
Figure 3.

Casein kinase 2 (CK2) increases nuclear factor kappa B (NF‐κB) phosphorylation and Bcl‐xL mRNA expression. Effects of CK2αWT DNA transfection and CK2α156A mutant DNA transfection on (A) NF‐κB phosphorylation at Ser529 and (B) Bcl‐xL mRNA expression in CA1 area. Animals received plasmid DNA transfection (1.5 µg) in CA1 area bilaterally and were sacrificed 48 h later. n = 6–10 each group. Statistical significance was evaluated by one‐way analysis of variance followed by Dunnett's t‐test. **P < 0.01. C. Immunohistochemical staining showing CK2αWT DNA transfection and expression in CA1 area (left panel, arrow indicates the area of plasmid expression). The anti‐HA‐tagged antibody and fluorescein isothiocyanate (FITC)‐conjugated IgG secondary antibody were used for visualization of plasmid transfection and expression in individual cells in CA1 area at a higher magnification (right panel). Dotted lines indicate the CA1 area. Scale bar equals 250 µm for the left panel and scale bar equals 25 µm for the right panel. D. Confocal images showed the co‐expression of CK2α and 4′,6‐diamidino‐2‐phenylindole (DAPI) in the same cells in CA1 area (upper panels). Arrow indicates the right half of the tissue showing coexpression and was used for viewing at a higher magnification (right three panels). Confocal images also showed the co‐expression of CK2α and NeuN in the same neurons in CA1 area (lower panels). Similarly, arrow indicates the right half of the tissue showing co‐expression and was further viewed at a higher magnification (right three panels). Scale bar of the lower left panel equals 100 µm and scale bar of the lower right panel equals 25 µm.
