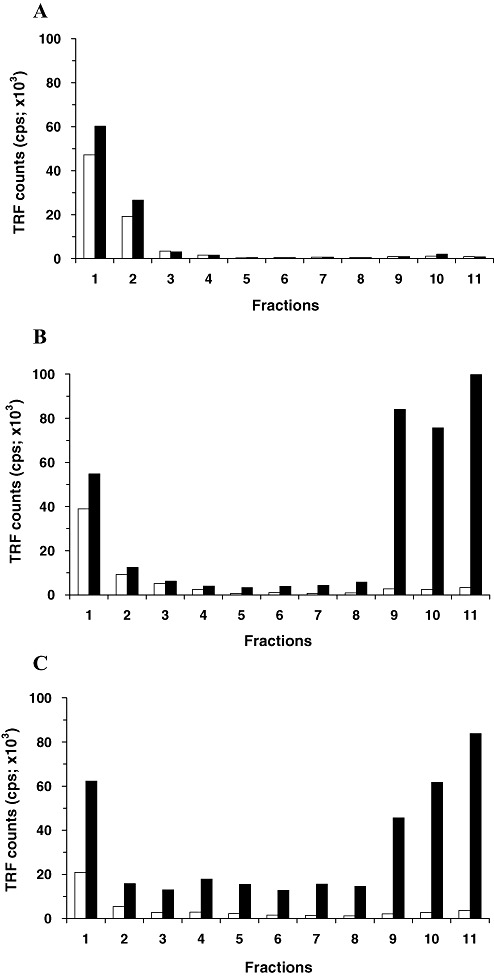
Figure 4.

Comparison of conformation‐dependent immunoassay (CDI) results between native and denatured states. CDI fluorescence signals from fractions of FC tissue of a control case (A), from fractions of FC tissue of a variant Creutzfeldt‐Jakob disease (vCJD) case (B) and from fractions of Th tissue of another vCJD case (C) were directly compared between the native (white bars) and denatured (black bars) folding states. Data shown represent the average for duplicate wells. Abbreviations: FC = frontal cortex; Th = posterior thalamus; TRF = time‐resolved fluorescence; CPS = counts per seconds.
