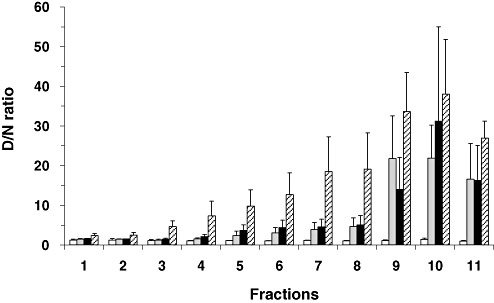
Figure 5.

Conformation‐dependent immunoassay (CDI) denatured/native (D/N) ratios for fractions derived from different regions of vCJD brains. The CDI D/N ratios for the fractions obtained by ultracentrifugation in the sucrose gradient were calculated by dividing TRF counts of denatured samples by the counts of the corresponding native samples. Data shown represent the average± SD obtained from five cases of FC of control (white bars) or from seven cases of vCJD FC (gray bars). In variant Creutzfeldt‐Jakob disease (vCJD) Cb (black bars) and vCJD Th (striped bars), data shown represent the average ± SD obtained from three cases. Abbreviations: FC = frontal cortex; Cb = cerebellum; Th = posterior thalamus; TRF = time‐resolved fluorescence; SD = standard deviation.
