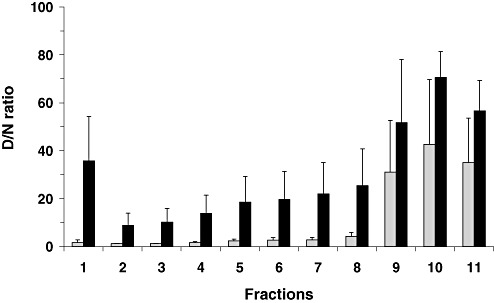
Figure 6.

Comparison of conformation‐dependent immunoassay (CDI) denatured/native (D/N) ratios for proteinase K (PK)‐treated fractions between frontal cortex (FC) and thalamus (Th) of variant Creutzfeldt‐Jakob disease (vCJD) brains. Eleven fractions from FC or Th of vCJD brains were digested with 2.5 µg/mL PK for 1 h at 37°C and then analyzed by CDI. The D/N ratios for individual fractions were calculated by dividing TRF counts of denatured samples by the counts of the corresponding native samples. Data shown represent the average ± SD obtained from six cases of vCJD FC (gray bars) and three cases of vCJD Th (black bars). The result in every individual was an average for duplicate wells. Abbreviations: TRF = time‐resolved fluorescence; SD = standard deviation.
