
Figure 6.
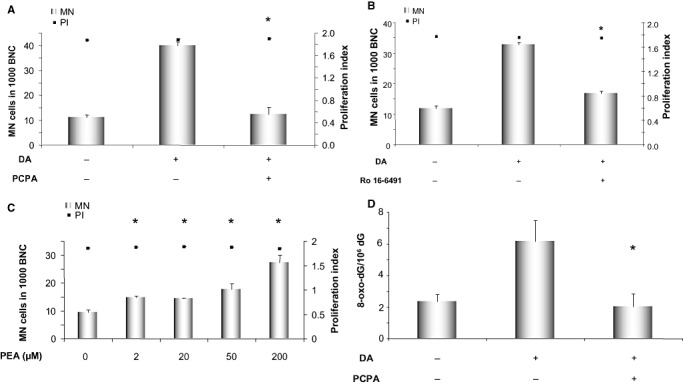
Micronucleus induction after treatment of PC12 cells with 100 µM of dopamine with or without co‐incubation with 50 µM of the monoamine oxidase inhibitor trans‐2‐phenylcyclopropylamine hydrochloride (PCPA) (A) or 1 µM of the MAO B specific inhibitor Ro 16‐6491 (B). (C) Micronucleus induction by the indicated concentration of monoamine oxidase substrate 1‐phenylethylamine (PEA). Proliferation index is illustrated on the right axis to ensure that all the samples equally underwent proliferation. (D) Mass spectrometric quantification of 8‐oxodG after treatment of PC12 cells with 100 µM of dopamine with or without co‐incubation with 50 µM of the monoamine oxidase inhibitor trans‐2‐phenylcyclopropylamine hydrochloride (PCPA). Displayed are averages with standard deviations of three independent experiments in A–C; D shows the average with standard deviation of two (negative control) or three (dopamine and dopamine + PCPA treated) independent experiments conducted in parallel. *P ≤ 0.05 vs. dopamine‐treated sample (A, B and D) or vs. control (C) (Mann–Whitney U‐test). Abbreviations: MN cells = micronucleated cells, BNC = binucleated cells.