Figure 6.

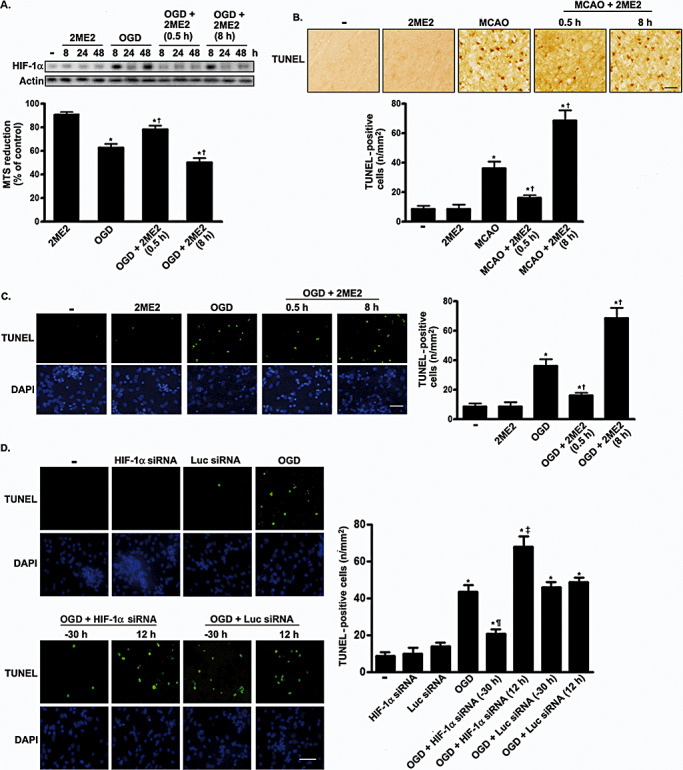
Representative images of TUNEL staining in cortex and primary neurons at 4 days after 2ME2 treatment or transfection with HIF‐1α siRNA. A. The viability of the cultured cortical neurons was assessed by performing the MTS assay. The HIF‐1α expression level was used as an internal control for the MTS assay. Experiments were performed in triplicate. Values are expressed as mean (SD) (n = 3). The percentage of cell viability in treated cells is relative to that in untreated cells. B. and C. Rat or primary neurons were treated with 2ME2 0.5 h or 8 h after ischemic challenge. Four days later, the cells were fixed, and TUNEL staining was performed. B,C. Scale bar, 100 µm. D. siRNA targeting HIF‐1α or luciferase was transfected into primary cortical neurons either 30 h before or 16 h after OGD. TUNEL staining was performed 4 days after OGD treatment. TUNEL‐positive cell counting analysis was determined under each condition. Scale bars, 50 µm. In panels B–D, quantification of TUNEL‐positive cells was presented as mean (SD) (n = 4). Statistical analysis was carried out using the one‐way ANOVA with appropriate post hoc tests; *P < 0.05 vs. the naive‐control and sham‐control group. †P < 0.05 vs. OGD and MCAO group. ¶P < 0.05 vs. OGD plus luciferase siRNA (−30 h) group. ‡P < 0.05 vs. OGD plus luciferase (12 h) group. Abbreviations: TUNEL = terminal deoxyuridine‐triphosphate nick‐end labeling; 2ME2 = 2‐methoxyestradiol; HIF‐1α = hypoxia‐inducible factor‐1‐alpha; siRNA = Small interfering RNA; MTS = methanethiosulfonate; SD = standard deviation; OGD = oxygen–glucose deprivation; MCAO = middle cerebral artery occlusion; DAPI = 4′,6‐diamidino‐2‐phenylindole; Luc = luciferase.
