


Figure 3.
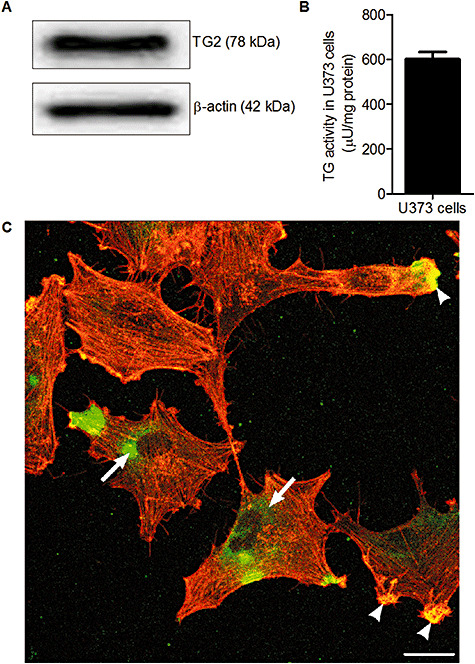
TG2 protein expression in U373 cells. A. TG2 protein expression in U373 cells, visualized using Western blot. B. TG activity in U373 cells. Data is expressed as mean (n = 8) + SEM. C. Immunoreactivity of TG2 (green) and F‐actin (red) in U373 cells. Scale bar: 100 µm.