


Figure 4.
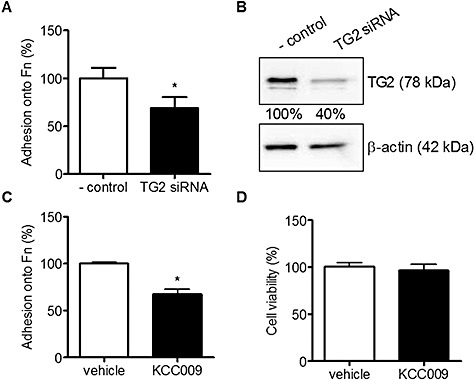
Adhesion of U373 cells onto Fn after reduction of TG2 protein expression or activity. A. Adhesion of U373 cells onto Fn coated wells in TG2 siRNA treated cells compared to nonsense siRNA treated cells (‐ control). B. TG2 protein expression levels after treatment with nonsense siRNA (‐ control) or TG2 siRNA, visualized using Western blot. Bands were semi‐quantified and corrected for β‐actin. C. Adhesion of U373 cells onto Fn coated wells after treatment with 0.5 mM KCC009 or vehicle. D. cell viability after treatment with 0.5 mM KCC009 or vehicle in U373 cells. Data are expressed as mean (n = 12) + SEM, *P < 0.05 compared to ‐ control or vehicle‐treated cells.