Fig. 1.
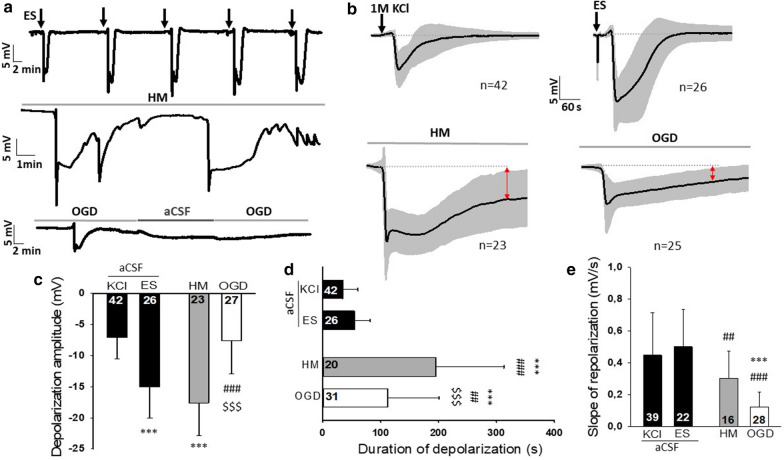
Electrophysiological characterization of spreading depolarizations. a Representative DC potential recordings demonstrate the experimental protocols. Slices were exposed to aCSF (SD initiation here: ES), HM, or OGD. Black vertical arrows indicate ES in aCSF, gray horizontal timelines depict the exposure to the experimental condition (HM or OGD). b The SD-related negative DC shifts (mean ± stdev) for each experimental group. Black vertical arrows indicate KCl application or ES in aCSF, gray horizontal timelines depict the exposure to the experimental condition (HM or OGD). Red arrows highlight incomplete repolarization relative to pre-SD baseline. c The maximum amplitude of SD. d The duration of SD. e The slope of repolarization. ES bipolar electric field stimulation, KCl microinjection of 1 M KCl solution, HM hypo-osmotic medium, OGD oxygen–glucose deprivation. Data are given as mean ± stdev. Sample size (i.e. number of SD events analyzed) is indicated in each bar. One-way analysis of variance (ANOVA) followed by a Holm-Sidak post hoc test was used for statistical analysis. The level of significance is given as p < 0.001*** vs. KCl; p < 0.01## and p < 0.001### vs. ES; p < 0.001$$$ vs. HM

