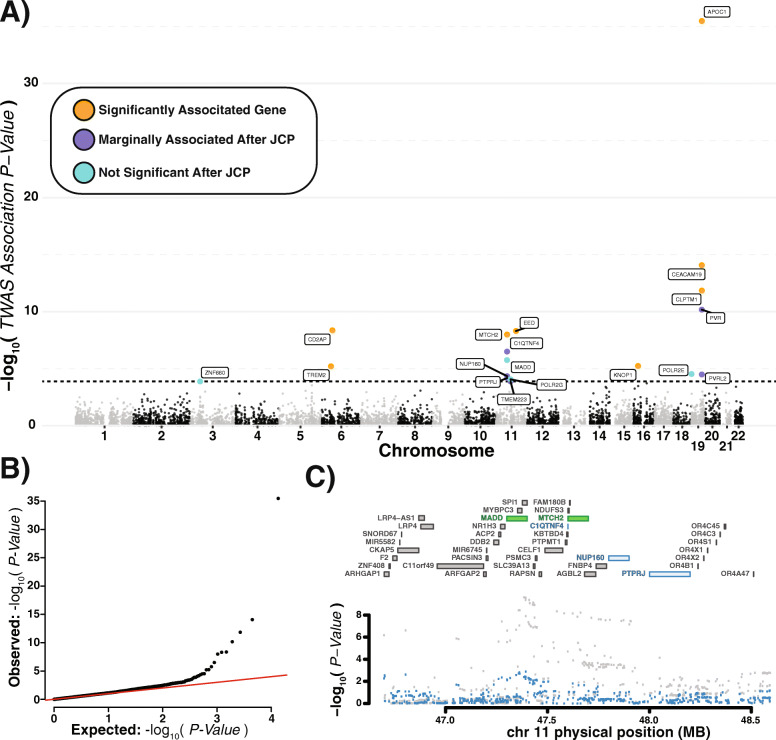
Fig. 2.
Transcriptome-wide association study results. a Log 10 TWAS association p values by gene shown by genomic location are indicated in black and grey. Features passing initial correction for multiple comparisons (above the dotted line), but marginally significant after joint conditional probability (JCP) are shown in purple. Those features which are no longer significant after JCP are shown in light blue, while genes surviving JCP are shown in yellow. b QQplot of all TWAS p values. c An example plot of a region tested for JCP. The candidate genes found to be marginally significant, NUP160 and PTPRJ, are colored blue while those found to be jointly significant, MADD and MTCH2, are colored green (upper), while individual SNP p values are colored grey before and blue after conditioning (lower)

