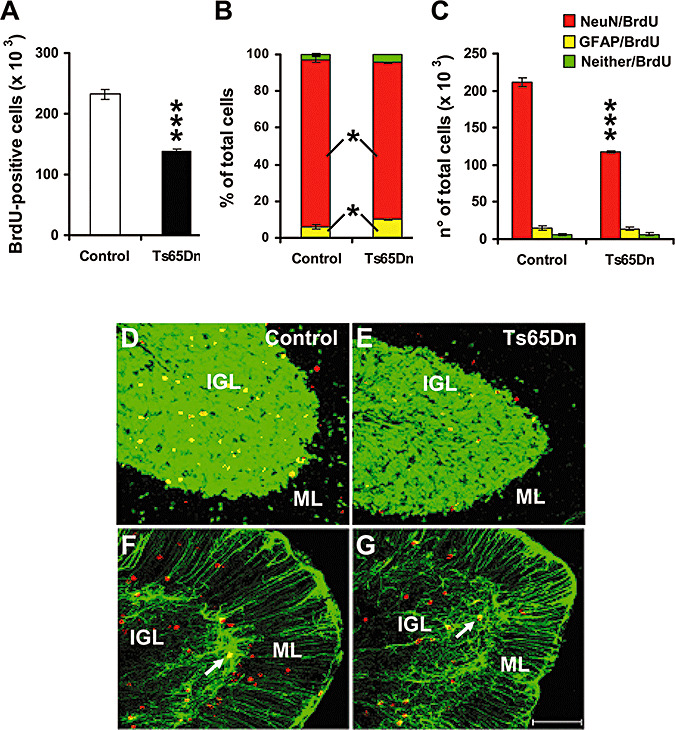
Figure 3.

Fate of proliferating cells in the cerebellum of Ts65Dn mice. A: Total number of BrdU‐positive cells in IGL of the cerebellum of control (n = 5) and Ts65Dn (n = 5) mice that had received on P2 one BrdU injection and were sacrificed after 28 days. B, C: Percentage (B) and absolute number (C) of surviving cells with neuronal phenotype (NeuN/BrdU), astrocytic phenotype (GFAP/BrdU) and undetermined phenotype (Neither/BrdU) in the IGL in the same animals as in (A). Values are means ± SEM. D, E, F, G: Confocal microscopy images of sagittal sections across the cerebellum, showing BrdU‐ (red), NeuN‐ (green), and BrdU+NeuN‐ (yellow) labeled cells in a control (D) and a Ts65Dn (E) mouse and BrdU‐ (red), GFAP‐ (green) and BrdU+GFAP‐ (yellow, arrows) labeled cells in a control (F) and a Ts65Dn (G) mouse. These animals received one BrdU injection on P2 and were sacrificed after 28 days. The scale bar (75 µm) applies to all the figures. Abbreviations: IGL, internal granular layer; ML, molecular layer. *P < 0.05; ***P < 0.001 (Student's two tailed t‐test).
