
Figure 2.
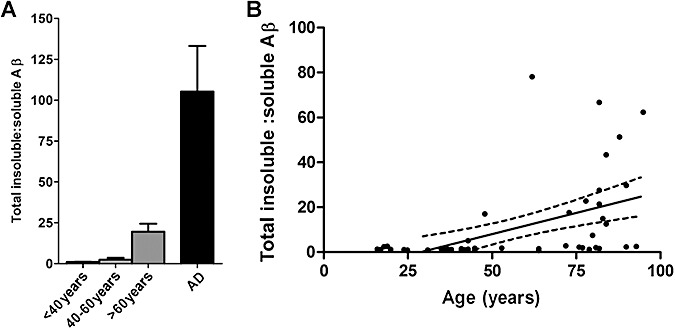
Proportions of soluble and insoluble amyloid β (Aβ) differ in AD and controls. (A) The insoluble : soluble Aβ ratio was significantly higher in the >60 years controls than in the <40 years (P= 0.003) or 40–60 years (P= 0.006) subgroups. The insoluble : soluble ratio was approximately five‐fold higher still in AD brains than the >60 years controls (P < 0.0001). The bars indicate the mean values ± standard error of the mean. (B) In control brains, the ratio of insoluble : soluble Aβ increased with age (P < 0.0001, r = 0.637). The individual points represent the mean values for each case. Also shown are the best‐fit linear regression lines (solid) and 95% confidence intervals (interrupted lines).