Figure 2.

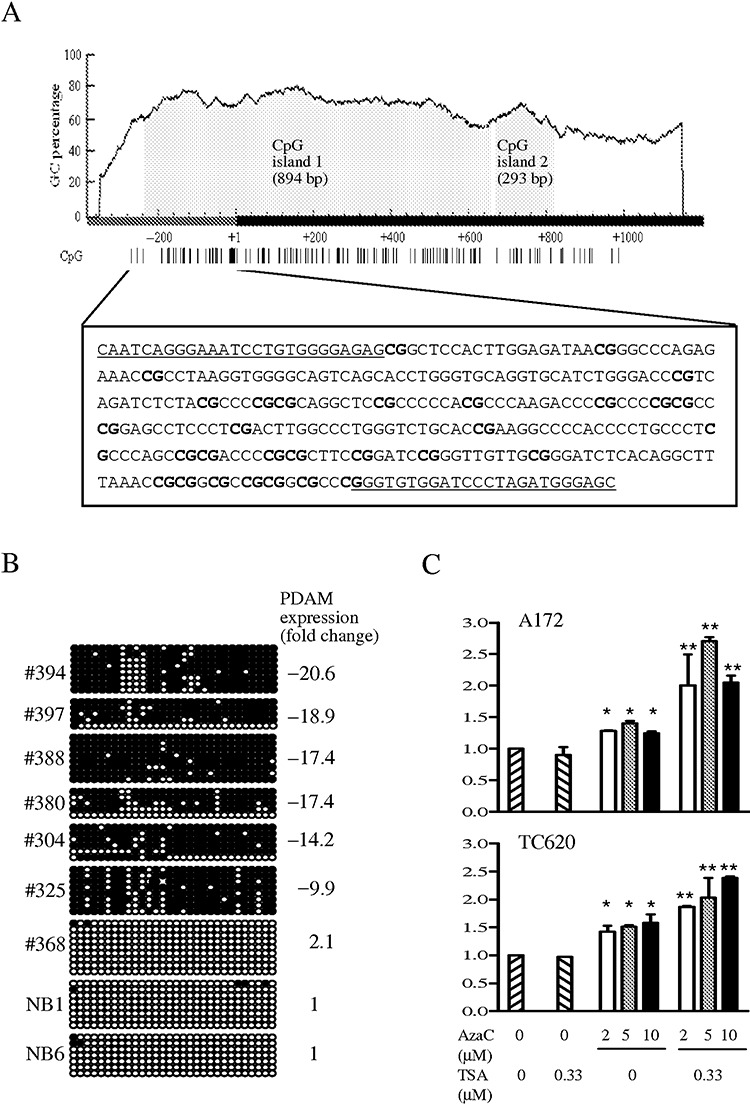
A. Two CpG islands are predicted on the p53‐depdendent apoptosis modulator (PDAM) gene by MethPrimer using prediction criteria of GC content >50% and a ratio of observed CpG to expected CpG >0.6 over a minimum length of 500 bp. CpG island 1 spans 242 bp of the putative promoter region and 652 bp of exon 1, whereas CpG island 2 lies in exon 1. The dark bar represents the 5′ end of PDAM transcript with the transcriptional start site designated as +1. The distribution of CpG sites (vertical lines) is shown below the graph. The boxed DNA sequence indicates the putative promoter region in which 30 CpG dinucleotides (bold) are interrogated for methylation by bisulfite sequencing. The underlined sequences represent regions where primers for amplification of modified DNA are designed. B. Representative results of bisulfite sequencing of 30 CpG sites examined. Each circle represents the methylation status of a CpG dinucleotide, with dark circle indicating methylation and open circle representing unmethylation. The CpG sites arranged in order from 5′ to 3′ are shown in left‐to‐right orientation. Case numbers and PDAM transcript level relative to normal brain (NB) expressed as fold change are also shown. C. Effects of azacytidine (AzaC) alone or in combination with trichostatin A (TSA) on PDAM expression monitored by quantitative reverse transcription–polymerase chain reaction. PDAM expression was significantly increased in AzaC‐treated A172 and TC620 cells (*P < 0.05), and was further enhanced upon combined treatment with AzaC and TSA (**P < 0.01).
