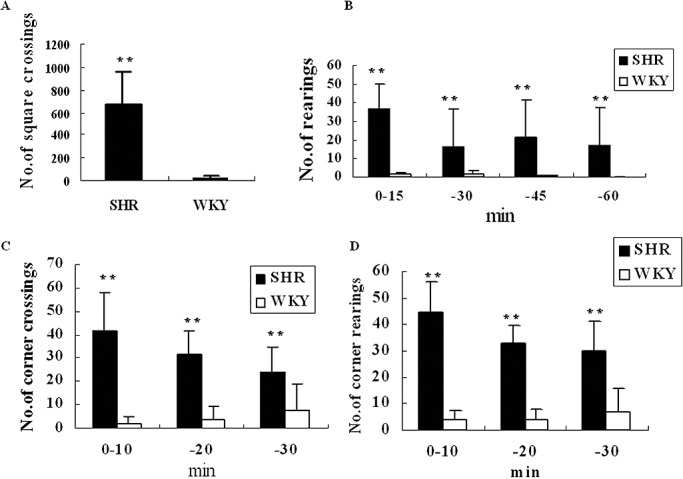
Figure 1.

Behavioral task comparison between spontaneously hypertensive rats (SHR) and Wistar–Kyoto (WKY) rats. A. Comparison of the total number of square crossings in 1 h open‐field test; B. Comparison of the number of rearings among 15 minutes groups in 1‐h open‐field test; C. Number comparison of corner crossings among 10‐minute groups in 30‐minute làt‐maze test; D. The number comparison of corner rearings among 10‐minute groups in 30‐minute làt‐maze test. Data were given as an average of the number of crossings or rearings with standard errors, where n = 5. **P < 0.01.
