
Figure 2.
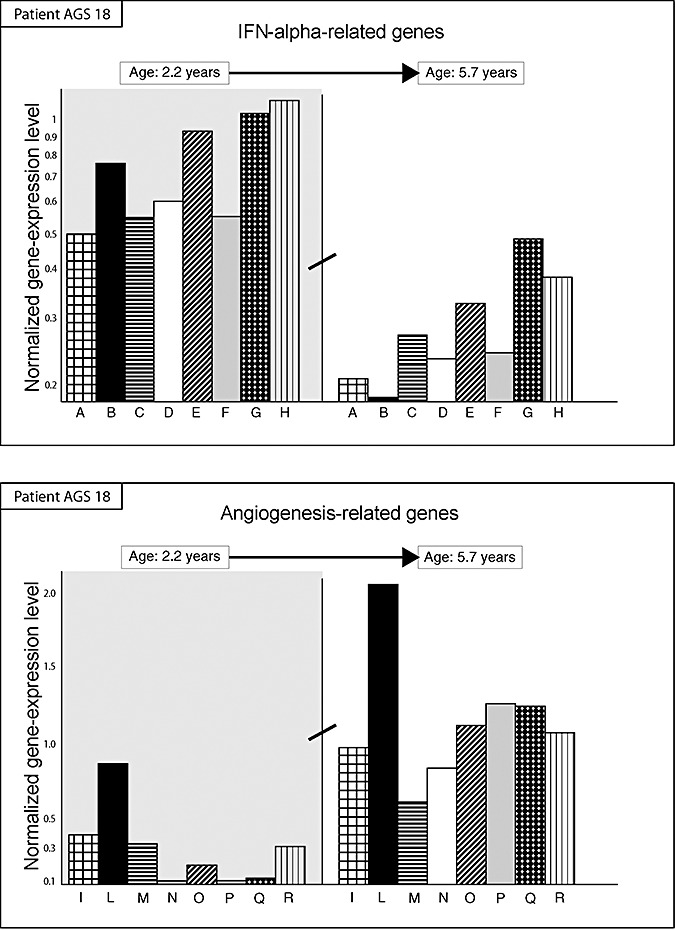
Time course variation in the transcriptional activity (vertical axis) of genes in a single patient with Aicardi–Goutières syndrome (AGS) (AGS18) undergoing serial microarray analyses at 2.2‐ (left part, gray background) and 5.7‐year (right part, white background). A significant trend towards the decrease in the expression of 8 interferon (IFN)‐alpha‐related genes (columns) was observed (upper panel). These genes include from left to right: (A) interleukin‐13 receptor; (B) IFN‐responsive protein 28 kD; (C) leukocyte alpha‐interferon; (D) IFN‐alpha 8; (E) IFN‐related factor 3; (F) IFN‐related factor 7; (G) IFN‐induced cellular resistance protein; (H) IFN‐receptor 1. An opposite significant trend was observed for eight angiogenesis‐related genes (lower panel). These genes include from left to right: (I) microvascular endothelial differentiation gene 1; (L) vascular mucosa molecule 1; (M) angiopoietin‐like factor 7; (N) vascular endothelial junction‐associated molecule; (O) vascular endothelial growth factor C; (P) endothelial angiotensinase C; (Q) angiopoietin 1; (R) angiomotin promoting endothelial cell migration and vessel formation.