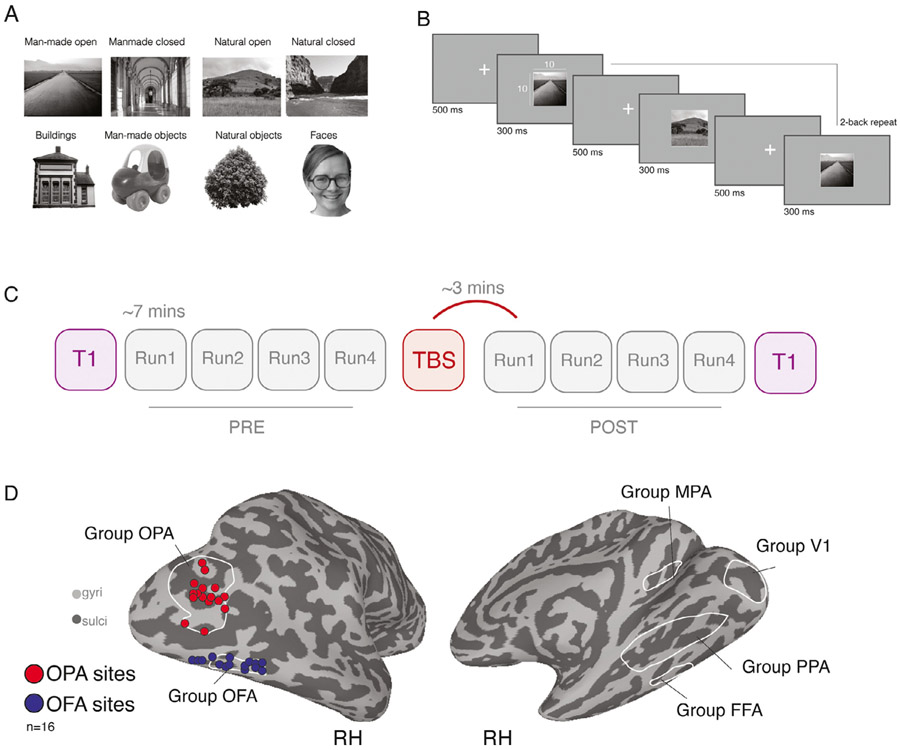
Fig. 1.
Example stimuli, task schematic, experimental design and TBS target sites. A, Example stimuli from eight categories: Four scene-categories and four non-scene categories. B, Task schematic. Stimuli were presented in blocks. Participants fixated centrally and were required to push a button every time a 2-back repeat occurred. C, Schematic of experimental design. Each session began with a T1-weighted scan, followed by four Pre-TBS runs of the task, each lasting ~7 mins. Following the end of Pre Run4, participants were removed from the scanner and TBS was performed. Four Post-TBS runs were then acquired followed by a second T1-weighted image. The first Post-TBS volumes were acquired ~3 mins following the cessation of TBS. D, Left: Individual TMS stimulation sites (red = OPA, blue = OFA). Individual participant (n = 16) stimulation sites are overlaid onto a partially inflated lateral view of the right hemisphere (gyri = light gray, sulci = dark gray). Right: Group ROIs overlaid onto a medial view of the right hemisphere.

