
Figure 6.
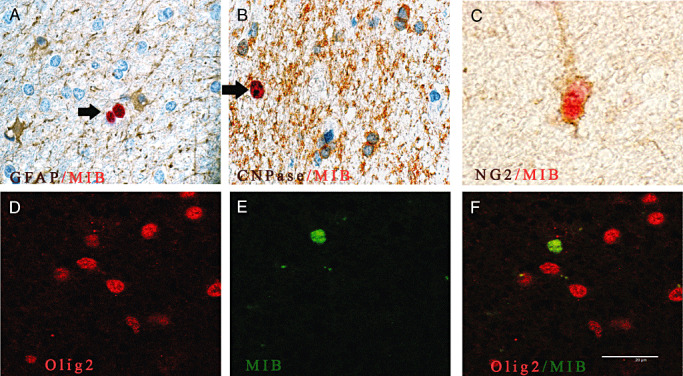
Double immunostainings show that cycling cells co‐express Olig2 or NG2 in the surgical control brain. A,B. No Mib‐1‐positive cells (red, arrow) co‐express GFAP (brown) (A) or CNPase (brown) (B). C. All Mib‐1‐positive cells (red) co‐localized with non‐endothelial NG2‐positive cells (brown). D–F. Confocal microscopy of double immuno‐fluorescence stainings of Olig2 (red, D) and Mib‐1 (green, E) reveal that all Mib‐1‐positive cells co‐express Olig2 (F, overlay of D and E). Magnification in A,B,D,E and F: ×600; C: ×1000. Scale bar = 20 µm. Abbreviations: GFAP = glial fibrillary associated protein; CNPase = 2′ 3′‐cyclic nucleotide 3′‐phosphodiesterase; Mib‐1 = Ki‐67.