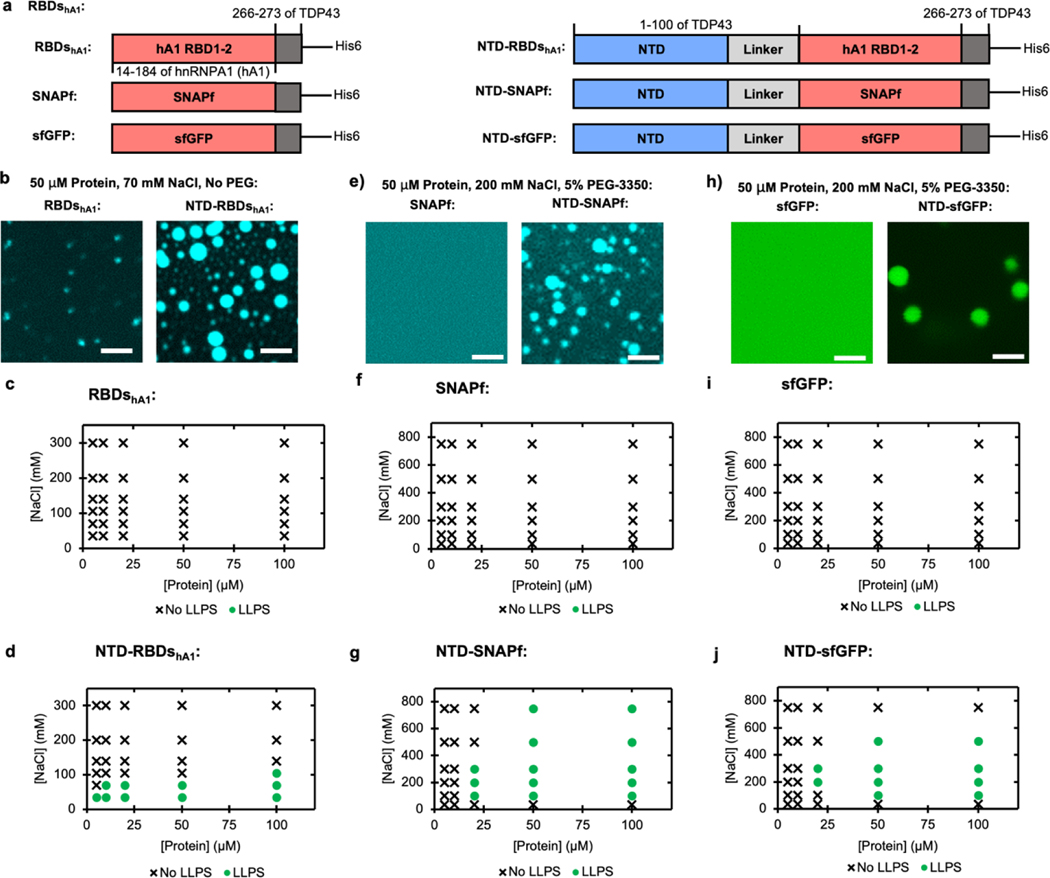
Figure 2 |. The NTD of TDP43 can be used to enhance LLPS of other proteins.
(a) Schematics of protein fusions, with or without TDP43’s NTD: hnRNPA1 RBDs constructs used in (b - d), SNAPf constructs used in (e - g), and sfGFP constructs used in (h - j). (b) Fluorescent microscopy of hnRNPA1 RBDs without (left) or with (right) fused NTD. Each sample contains 50 μM total protein, including 45 μM unlabeled protein and 5 μM protein labeled with fluorescein via maleimide conjugation. Scale bars are 5 μm. (c-d) Phase diagrams of hnRNPA1 RBDs without (c) or with (d) fused NTD at varying salt and protein concentrations without the addition of PEG. LLPS determined by turbidity values (Supplemental Figure S5a–b) with LLPS defined as absorbance > 0.3 AU. (e) Fluorescent microscopy of SNAPf without (left) or with (right) fused NTD. Each sample contains 50 μM protein with 5 μM coumarin labeled through conjugation to SNAPf’s target substrate, benzyl guanine. Scale bars are 5 μm. (f-g), Phase diagrams of SNAPf without (f) or with (g) fused NTD at varying salt and protein concentrations with the addition of 5% w/v PEG-3350. LLPS determined by turbidity values (Supplemental Figure S5c–d) with LLPS defined as absorbance > 0.3 AU. (h) Fluorescent microscopy of sfGFP without (left) or with (right) fused NTD. Scale bars are 5 μm. (i-j) Phase diagrams of sfGFP without (i) or with (j) fused NTD at varying salt and protein concentrations with the addition of 5% w/v PEG-3350. LLPS determined by turbidity values (Supplemental Figure S5e–f) with LLPS defined as absorbance > 0.3 AU.

