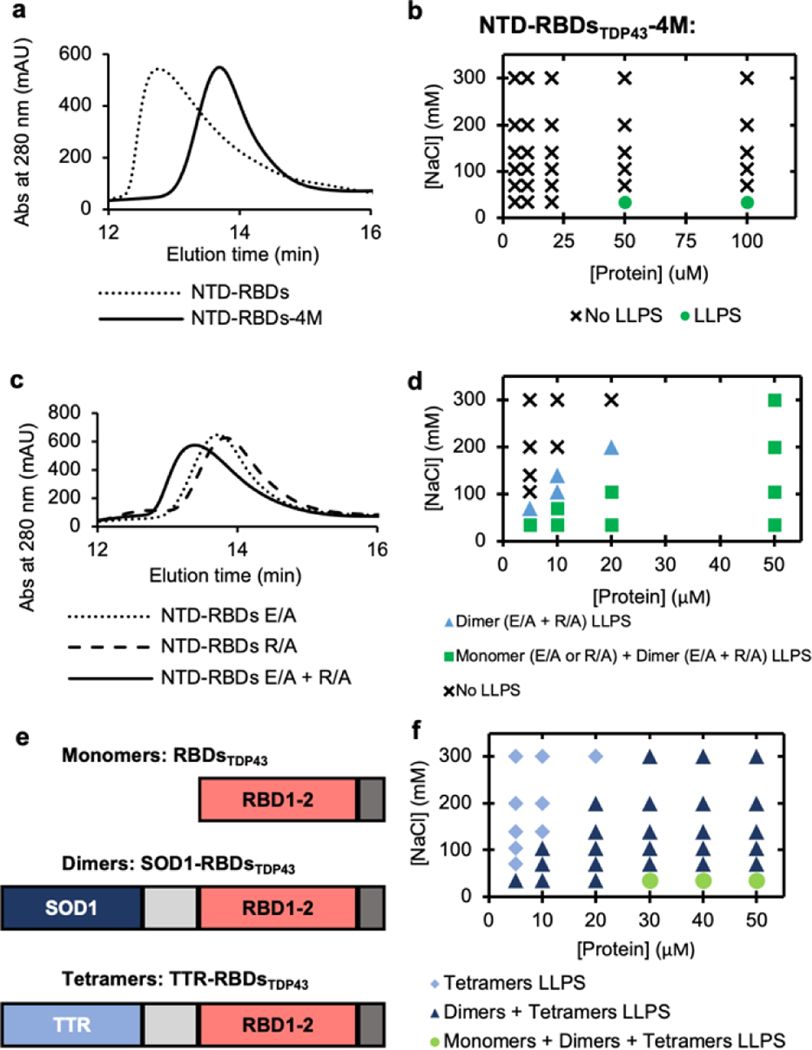
Figure 3 |. Oligomerization as the underlying factor in LLPS enhancement.
(a) Size exclusion chromatography (SEC) elution profile comparing NTD-RBDsTDP43 and oligomerization deficient mutant NTD-RBDsTDP43-4M. (b) Phase diagram of NTD-RBDsTDP43-4M at varying salt and protein concentrations without the addition of PEG. LLPS determined by turbidity values (Supplemental Figure S6a) with LLPS defined as absorbance > 0.3 AU. (c) SEC elution profile comparing monomeric NTD-RBDsTDP43 E/A or R/A to a sample of both monomers incubated together. (d) Phase diagram of salt vs protein concentration for E/A and R/A mutants. Marker denotes if no liquid-liquid phase separation (LLPS) occurs for any mixture (circle), LLPS occurs only for a dimeric mixture of NTD-RBDsTDP43 E/A and R/A (triangle), or if LLPS occurs for E/A, R/A, and a mixture of the two (square). Protein concentration shown as total protein concentration, with dimeric mixture containing 50% E/A and 50% R/A. Samples prepared in 10% w/v PEG-3350. LLPS determined by turbidity values (Supplemental Figure S6c–e) with LLPS defined as absorbance > 0.3 AU. (e) Schematics of protein constructs used to create monomers (RBDsTDP43), dimers (SOD1-RBDsTDP43), and tetramers (TTR-RBDsTDP43). (f) Phase diagram of salt vs protein concentration for oligomeric constructs. Marker denotes if LLPS occurred with only tetramer (diamond), tetramer and dimer (triangle), or tetramer, dimer and monomer (circle). Samples prepared in 10% w/v PEG-3350. LLPS determined by turbidity values (Supplemental Figure S5f–h) with LLPS defined as absorbance > 0.3 AU.

