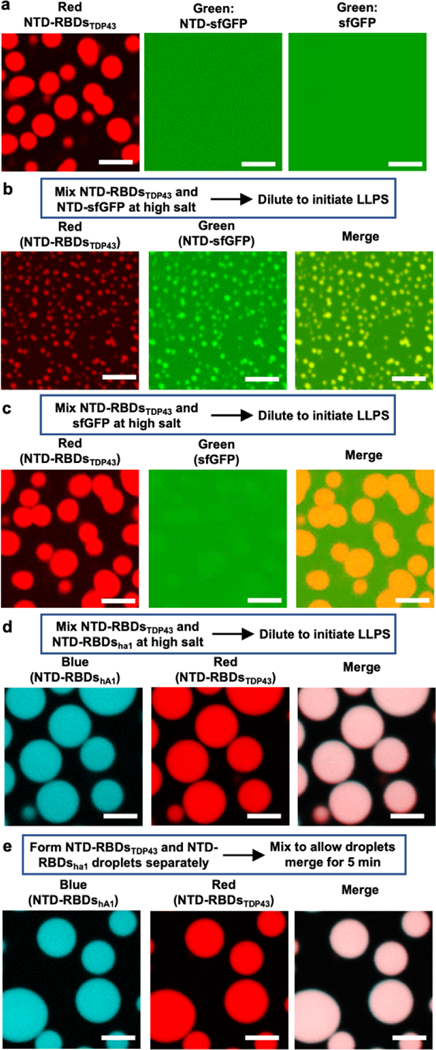
Figure 4 |. NTD drives colocalization of NTD-fusion proteins.
(a) Fluorescence microscopy of phase-separated NTD-RBDsTDP43 and diffusive NTD-sfGFP or sfGFP (50 μM protein at 100 mM NaCl). (b-c) Colocalization of NTD-RBDsTDP43 with NTD-sfGFP (b) or sfGFP (c). Left, 50 μM protein at 100 mM NaCl. Right, NTD-RBDsTDP43 incubated with either NTD-sfGFP (top row) or sfGFP (bottom row). Channels are Red, showing NTD-RBDsTDP43, Green, showing NTD-sfGFP or sfGFP, and a merge channel. NTD-RBDsTDP43 sample consists of 45 μM unlabeled protein and 5 μM protein labeled with rhodamine via maleimide conjugation. (d) Colocalization of NTD-RBDsTDP43 and NTD-RBDshA1 mixed before inducing LLPS. Left, schematic of experiment. Right, fluorescent confocal microscopy demonstrating colocalization. Channels are Blue, showing NTD-RBDshA1, Red, showing NTD-RBDsTDP43, and a merge channel. NTD-RBDsTDP43 sample prepared as in a. NTD-RBDshA1 sample consists of 45 μM unlabeled protein and 5 μM protein labeled with coumarin via maleimide conjugation. (e) Colocalization of NTD-RBDsTDP43 and NTD-RBDshA1 mixed after inducing LLPS. Left, schematic of experiment. Right, fluorescent confocal microscopy demonstrating colocalization. Channels and sample preparations as in b. All scale bars are 5 μm.

