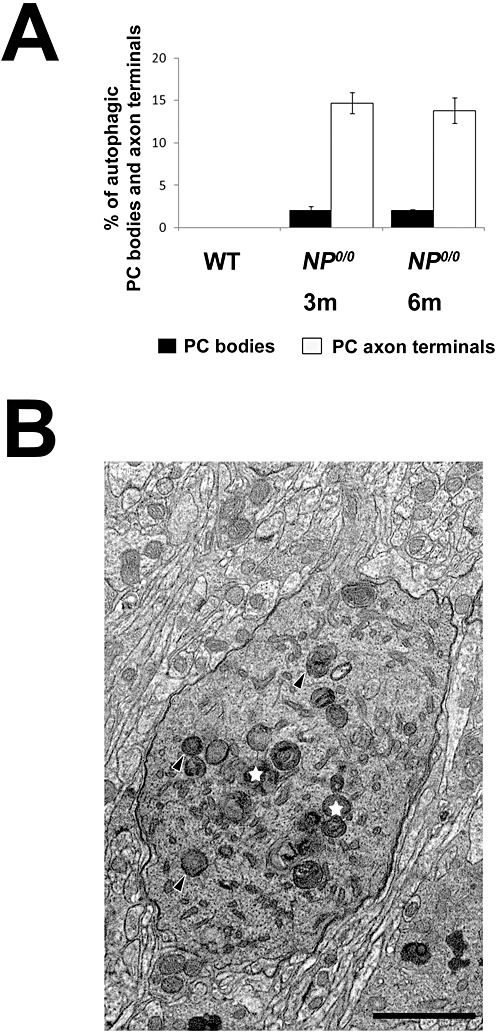
Figure 9.

A Semi‐quantitative analysis of autophagic PC somata and axon terminals in the cerebellar cortex and deep cerebellar nuclei of the 3 and 6 month‐old wild‐type (WT) and NP0/0 mice. The percentage of autophagic somata (black) and axon terminals (white) in the wild‐type and NP0/0 mice is plotted on y axis (A). Autophagosomes (black arrowheads) and autophagolysosomes (white stars) in the somatic neuroplasm of a PC in the cerebellar cortex of a 3 month‐old mouse (B). Bar = 2 μm.
