
Figure 1.
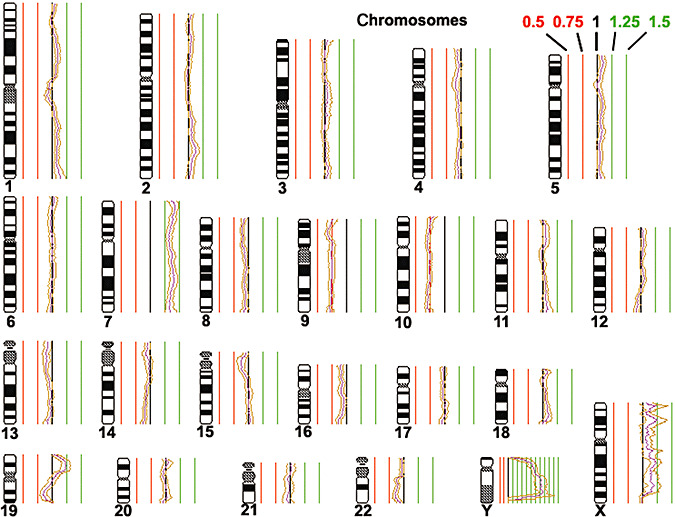
Comparative genomic hybridization (CGH) profile obtained for the tumor of patient 1. Thresholds for genomic gains are indicated in green, while thresholds for genomic losses are indicated in red. Note that the tumor shows a gain of chromosome 7 and losses of chromosomes 9 and 10.